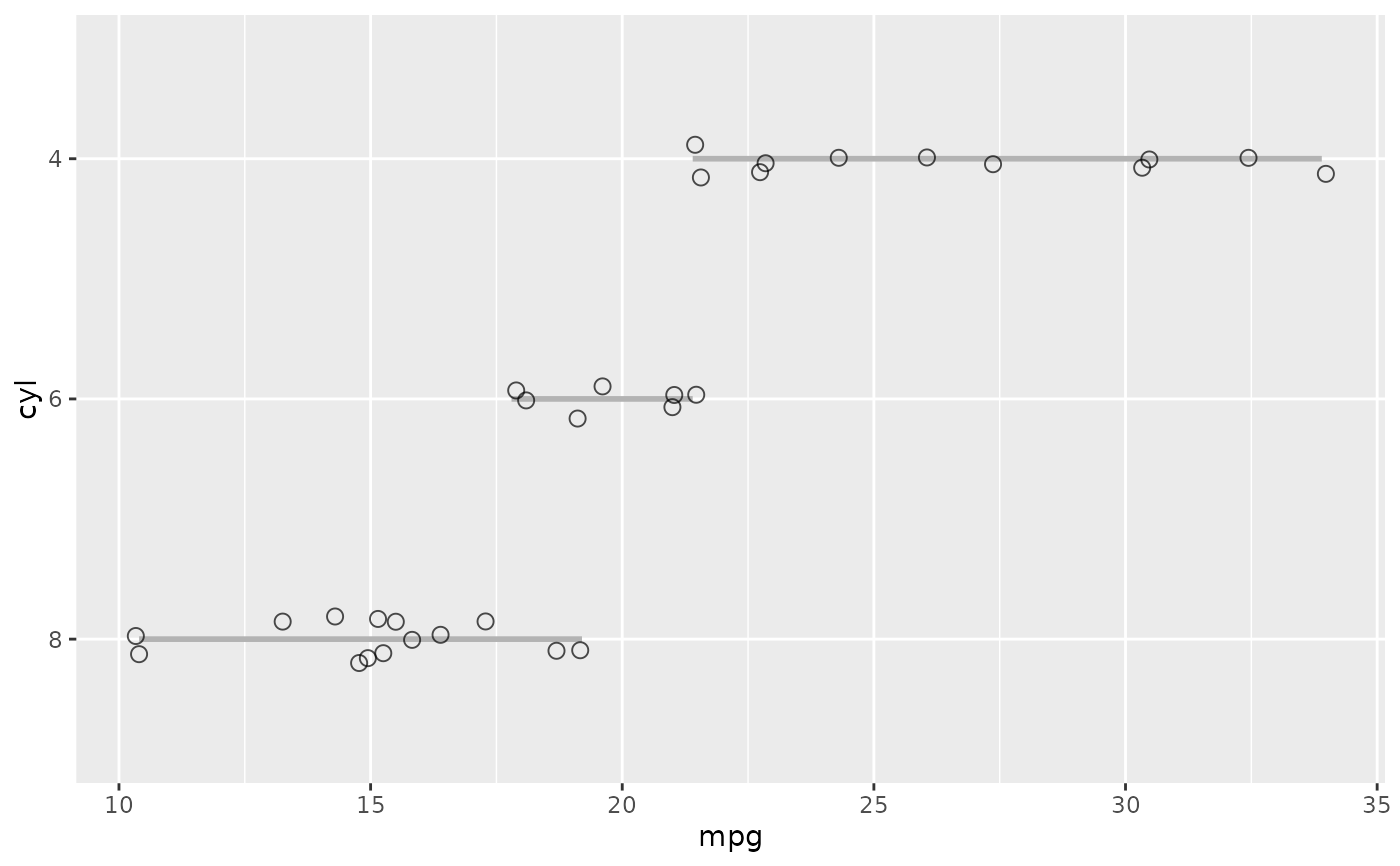
Produces a ggplot2 visualization showing the range (min to max) and distribution
of values for a numeric variable across different groups. Groups are ordered by
their median values in descending order.
Usage
plot_segment(data, col, group_col, group = NULL)
Arguments
- data
A data frame containing the variables to plot.
- col
Character string specifying the name of the numeric column to plot
on the x-axis.
- group_col
Character string specifying the name of the grouping column for
the y-axis.
- group
Deprecated. Use group_col instead.
Value
A ggplot2 object displaying:
Grey horizontal segments showing the range (min to max) for each group
Jittered points showing the distribution of individual observations
Groups ordered by median value (highest to lowest, top to bottom)
Details
The function:
Computes min, max, and median for each group
Handles infinite values by converting them to NA
Orders groups by median in descending order
Uses hollow circles (shape = 1) for points with 70% transparency
Applies minimal theme styling
Examples
plot_segment(mtcars, col = "mpg", group_col = "cyl")