
HR Analytics: Standard Report Prototype
04-standard_hrmis_assessment.RmdStandard HR Analytics Report
This report provides a standard set of indicators and visualizations on HRMIS analytics, building on the World Bank’s Public Sector and Employment Assessment Framework. The objective of this assessment is to conduct public sector employment and compensation assessments that can help develop evidence-based reforms.
The assessment framework consists of two parts. The first part assesses both the institutional and behavioral aspects of employment and compensation practices. It comprises six dimensions:
- Wage bill planning.
- Wage bill controls.
- Employment levels and distribution of the public sector workforce.
- Wage competitiveness of the public sector.
- Wage equity.
- Wage incentives.
The second part assesses the impact of these employment and compensation practices on:
- Fiscal sustainability.
- Public sector productivity.
- Labor allocation between the public and private sectors.
The wage bill represents a large and less flexible component of government expenditures with significant future liabilities. Globally, and noting the difficulties with cross-country comparisons, the wage bill represents approximately 30 percent of government expenditures, with significant variation around this average. This section presents some indicators that can help governments better understand and manage their wage bill.
Guidance questions for the assessment:
- What are the main stylized facts about the wage bill: its actual size, evolution, and decomposition into employment and wages?
- Is wage bill management anchored in comprehensive, accurate, and
timely data?
- Does the data cover all government employees paid from the budget and from extra-budgetary funds?
- Is the data derived from integrated payroll and human resource systems that are updated every pay cycle?
- Are budget classifications transparent so that all payroll expenditures are accurately recorded?
- Is wage bill planning integrated in a broader medium-term fiscal framework? Are forward budget estimates derived from models of future wage bill commitments?
- How does the institutional regime for salary setting impact wage bill planning? Are there particular challenges for subnational wage bill planning due to mismatches in staffing decisions and funding between central and subnational governments?
- Are staffing increases informed by needs and medium-term strategic planning, or primarily by short-term political considerations?
- Is there any public debate or public disclosure around wage bill policies?
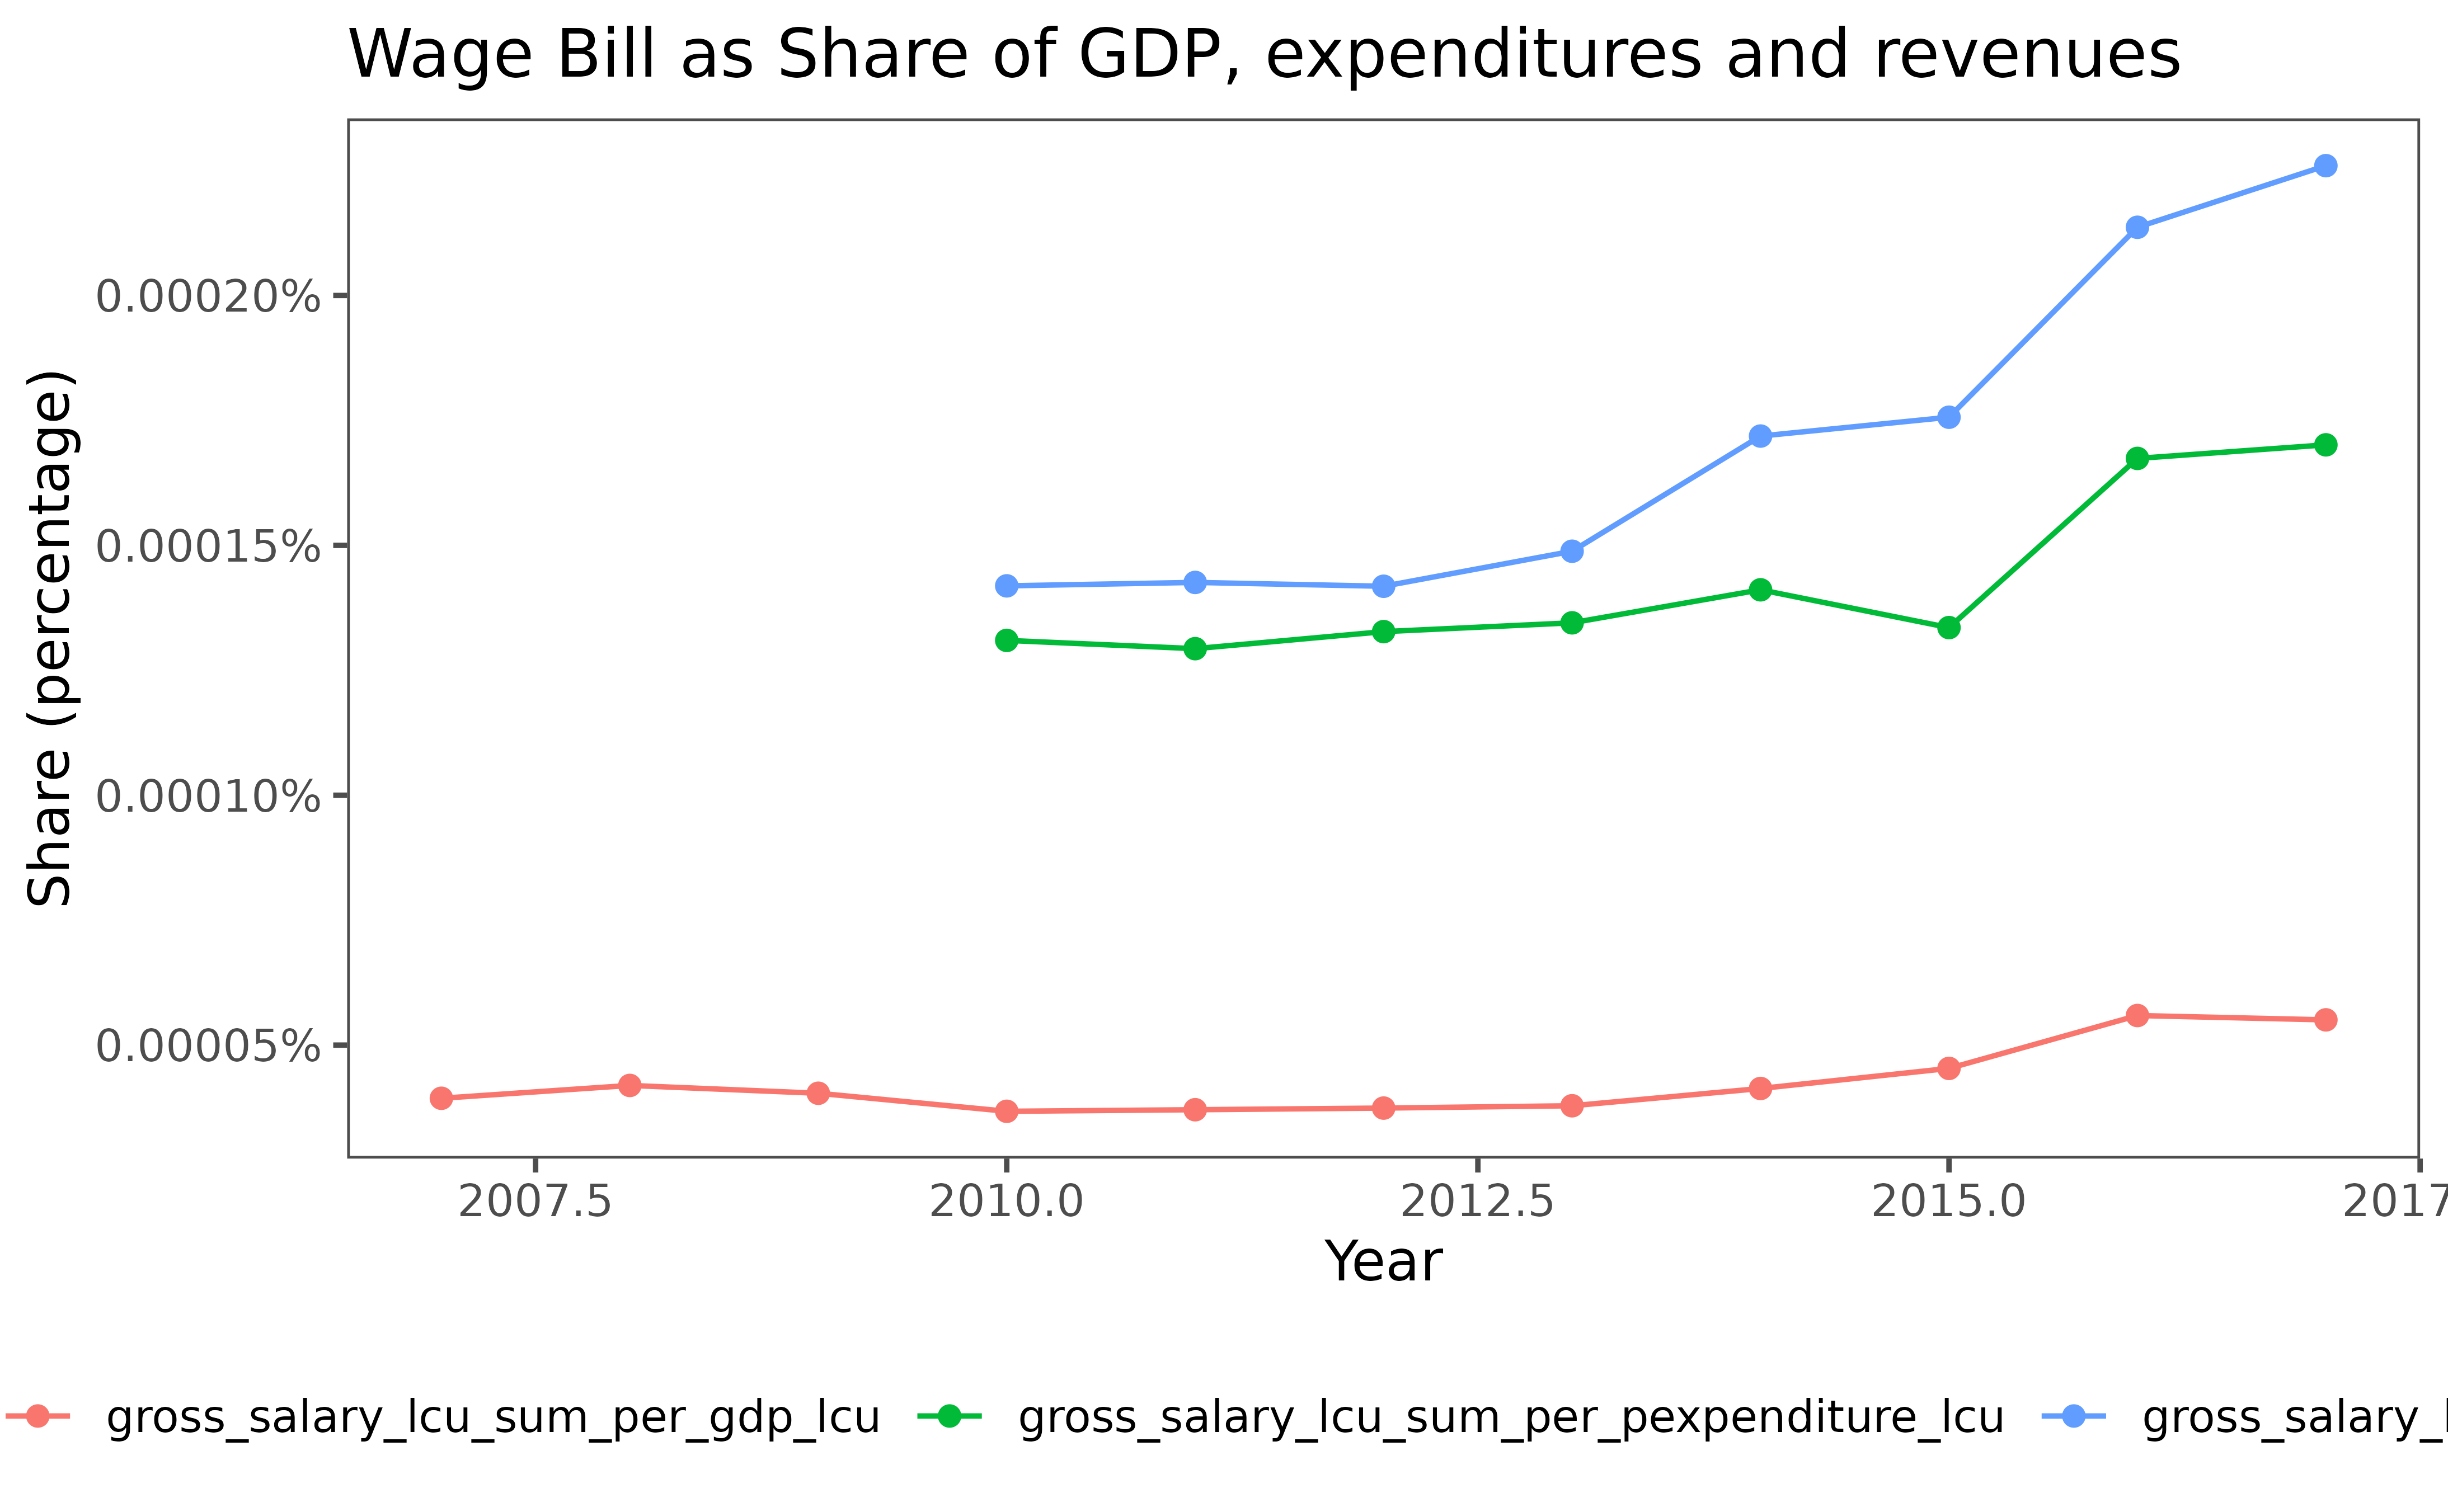
3.1.1. Wage bill as share of GDP, expenditures, and revenues
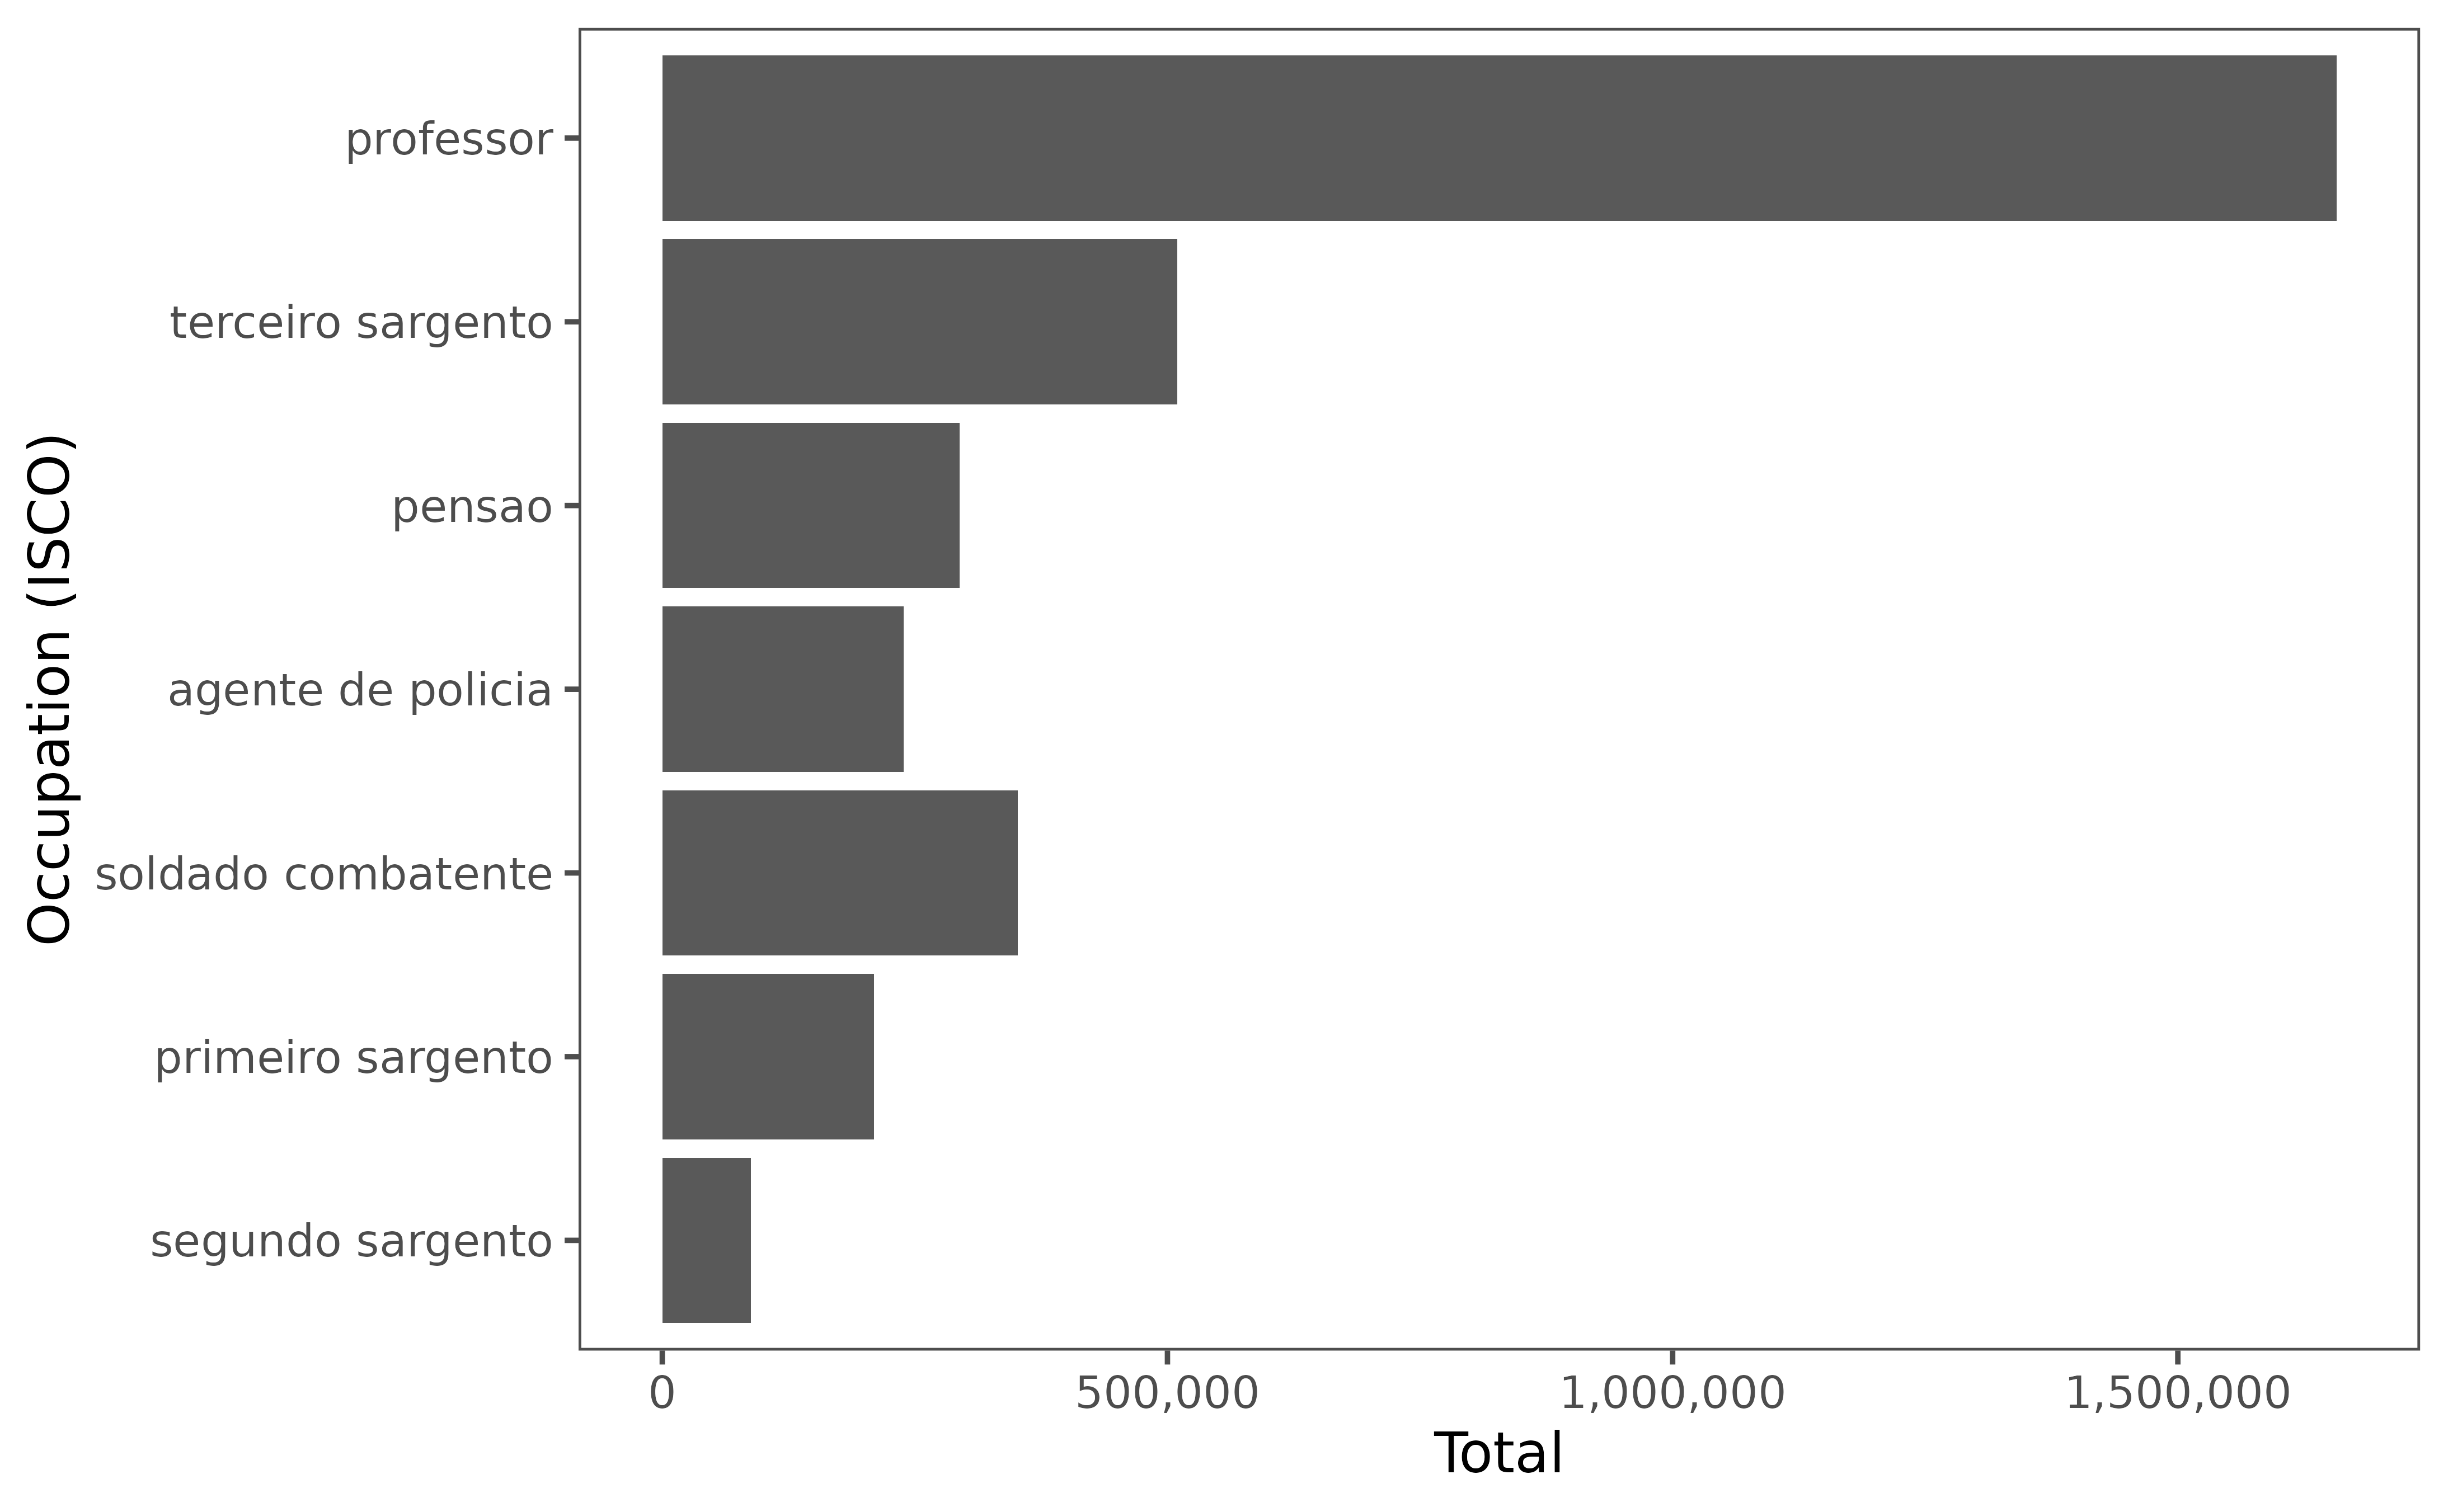
3.1.2. Wage bill decomposed by administrative and industry classification
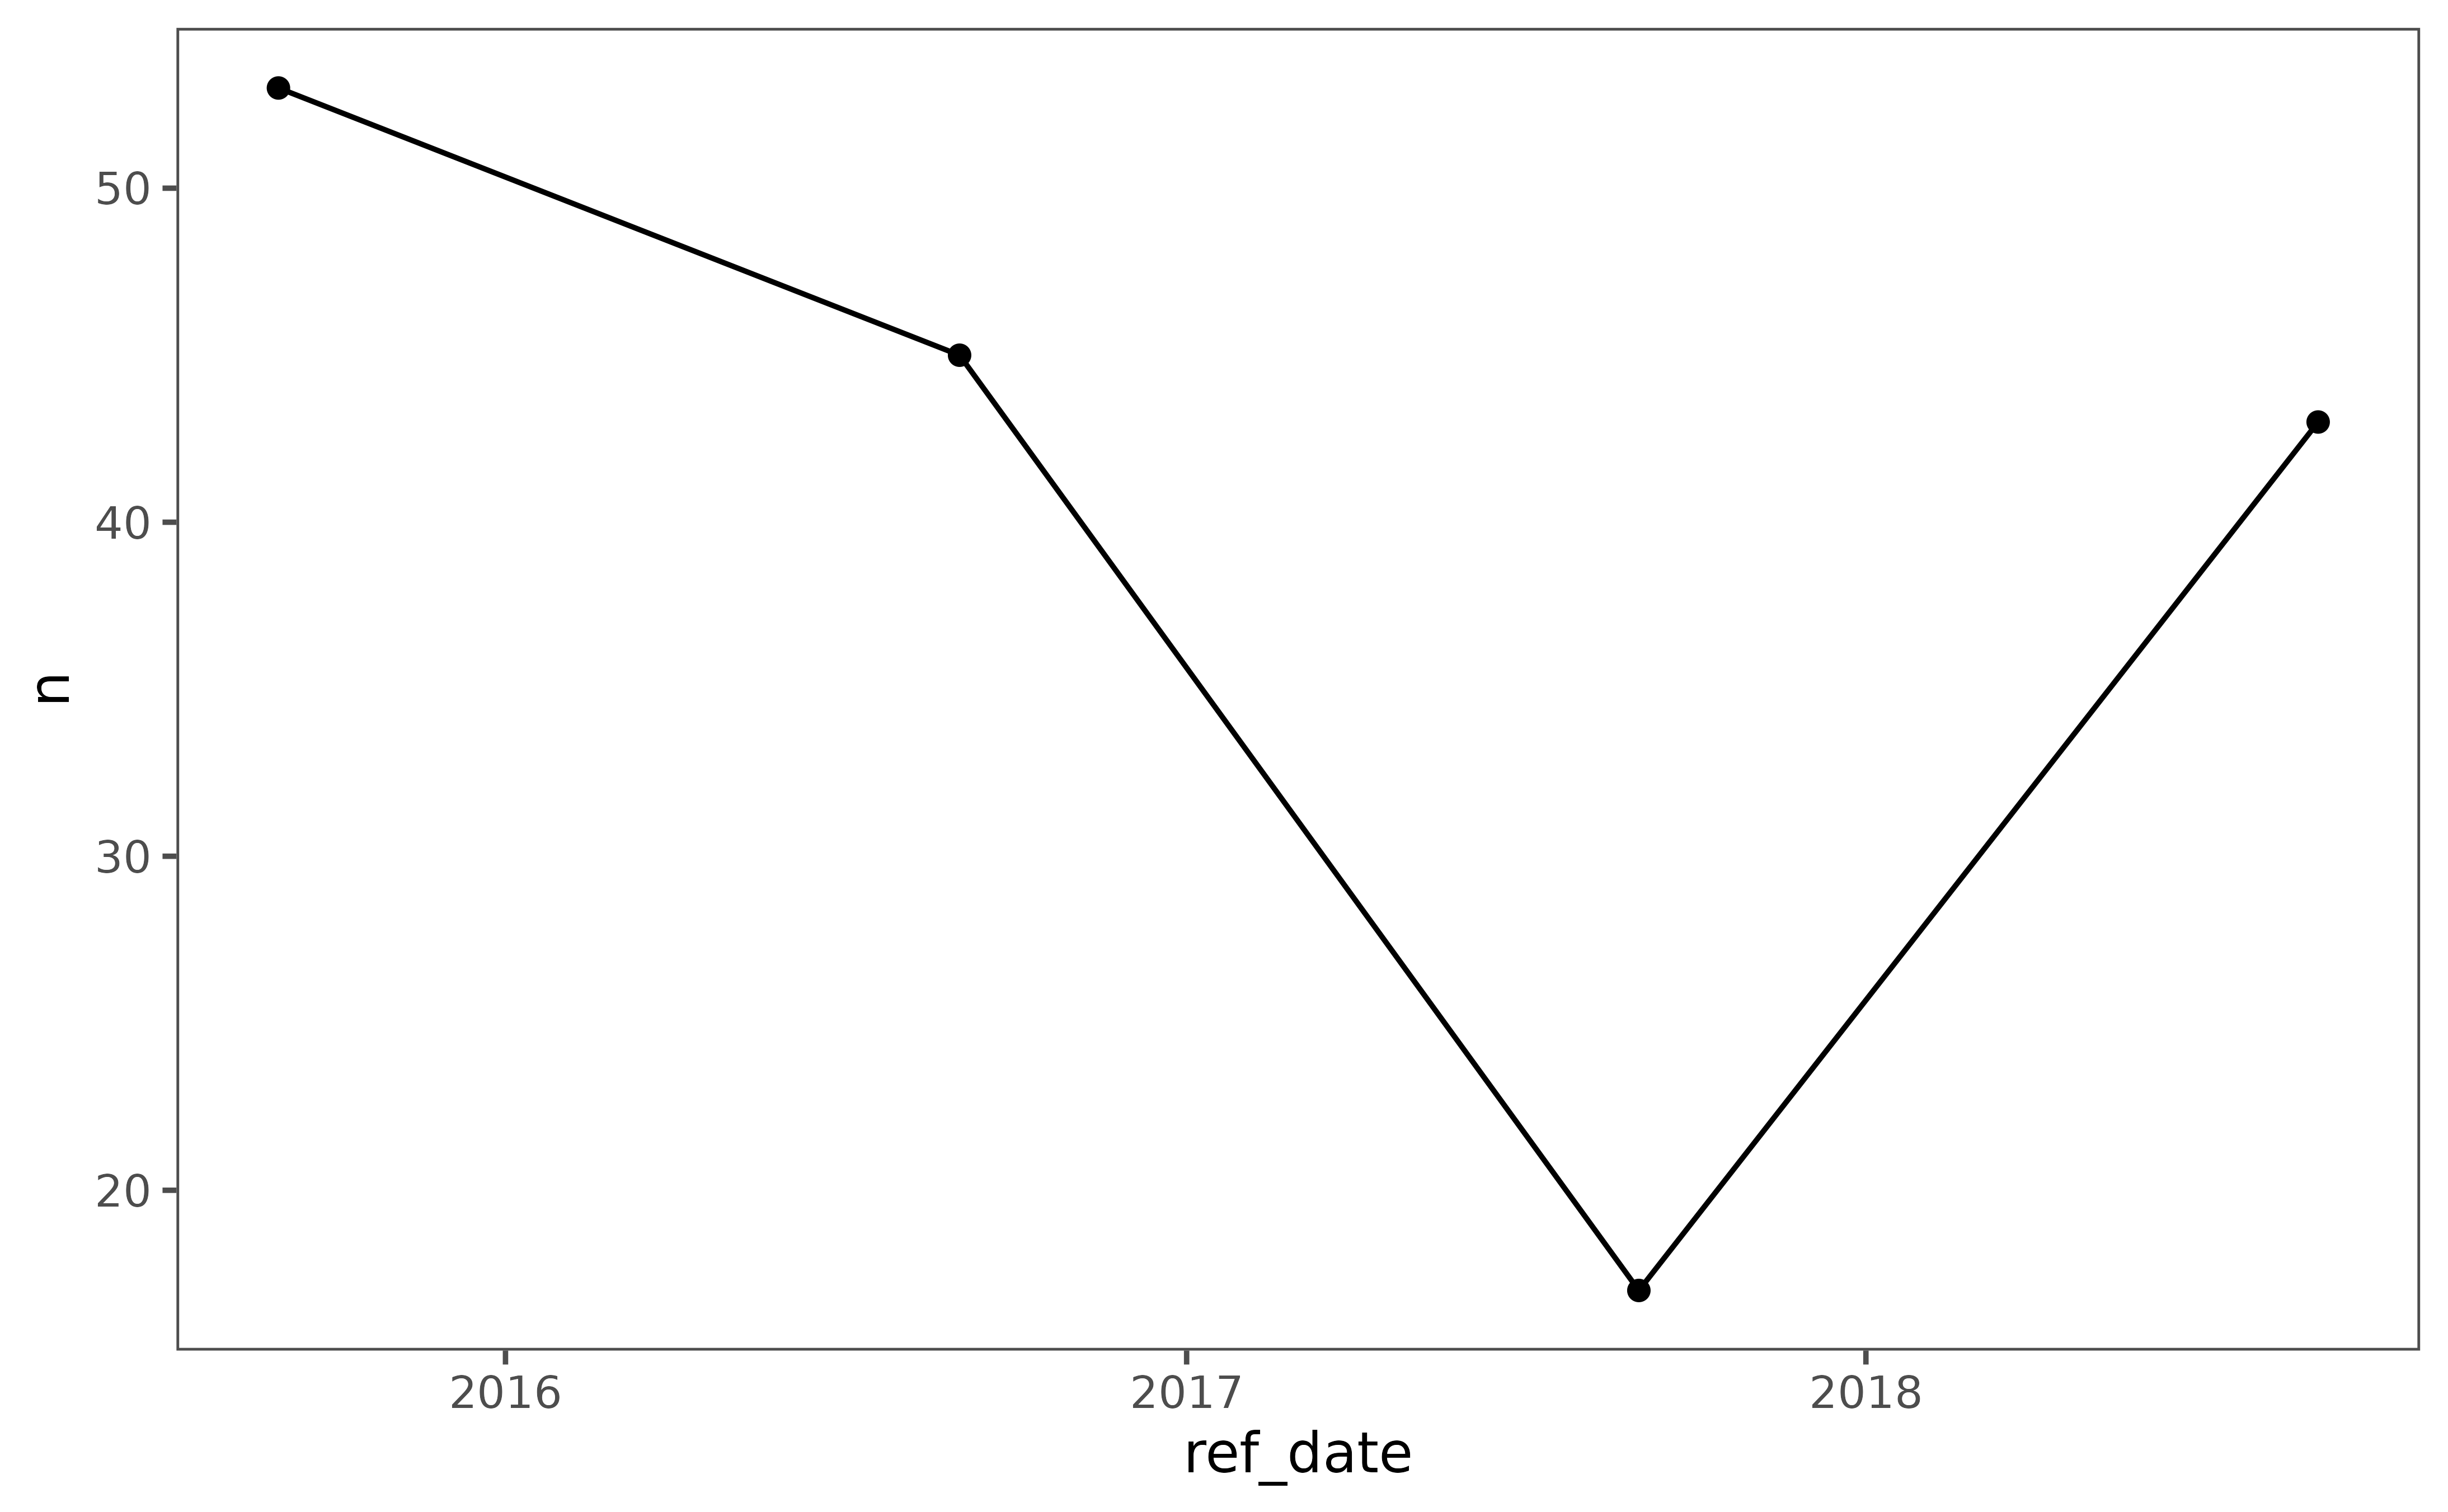
3.1.3. Annual recruitment patterns over time
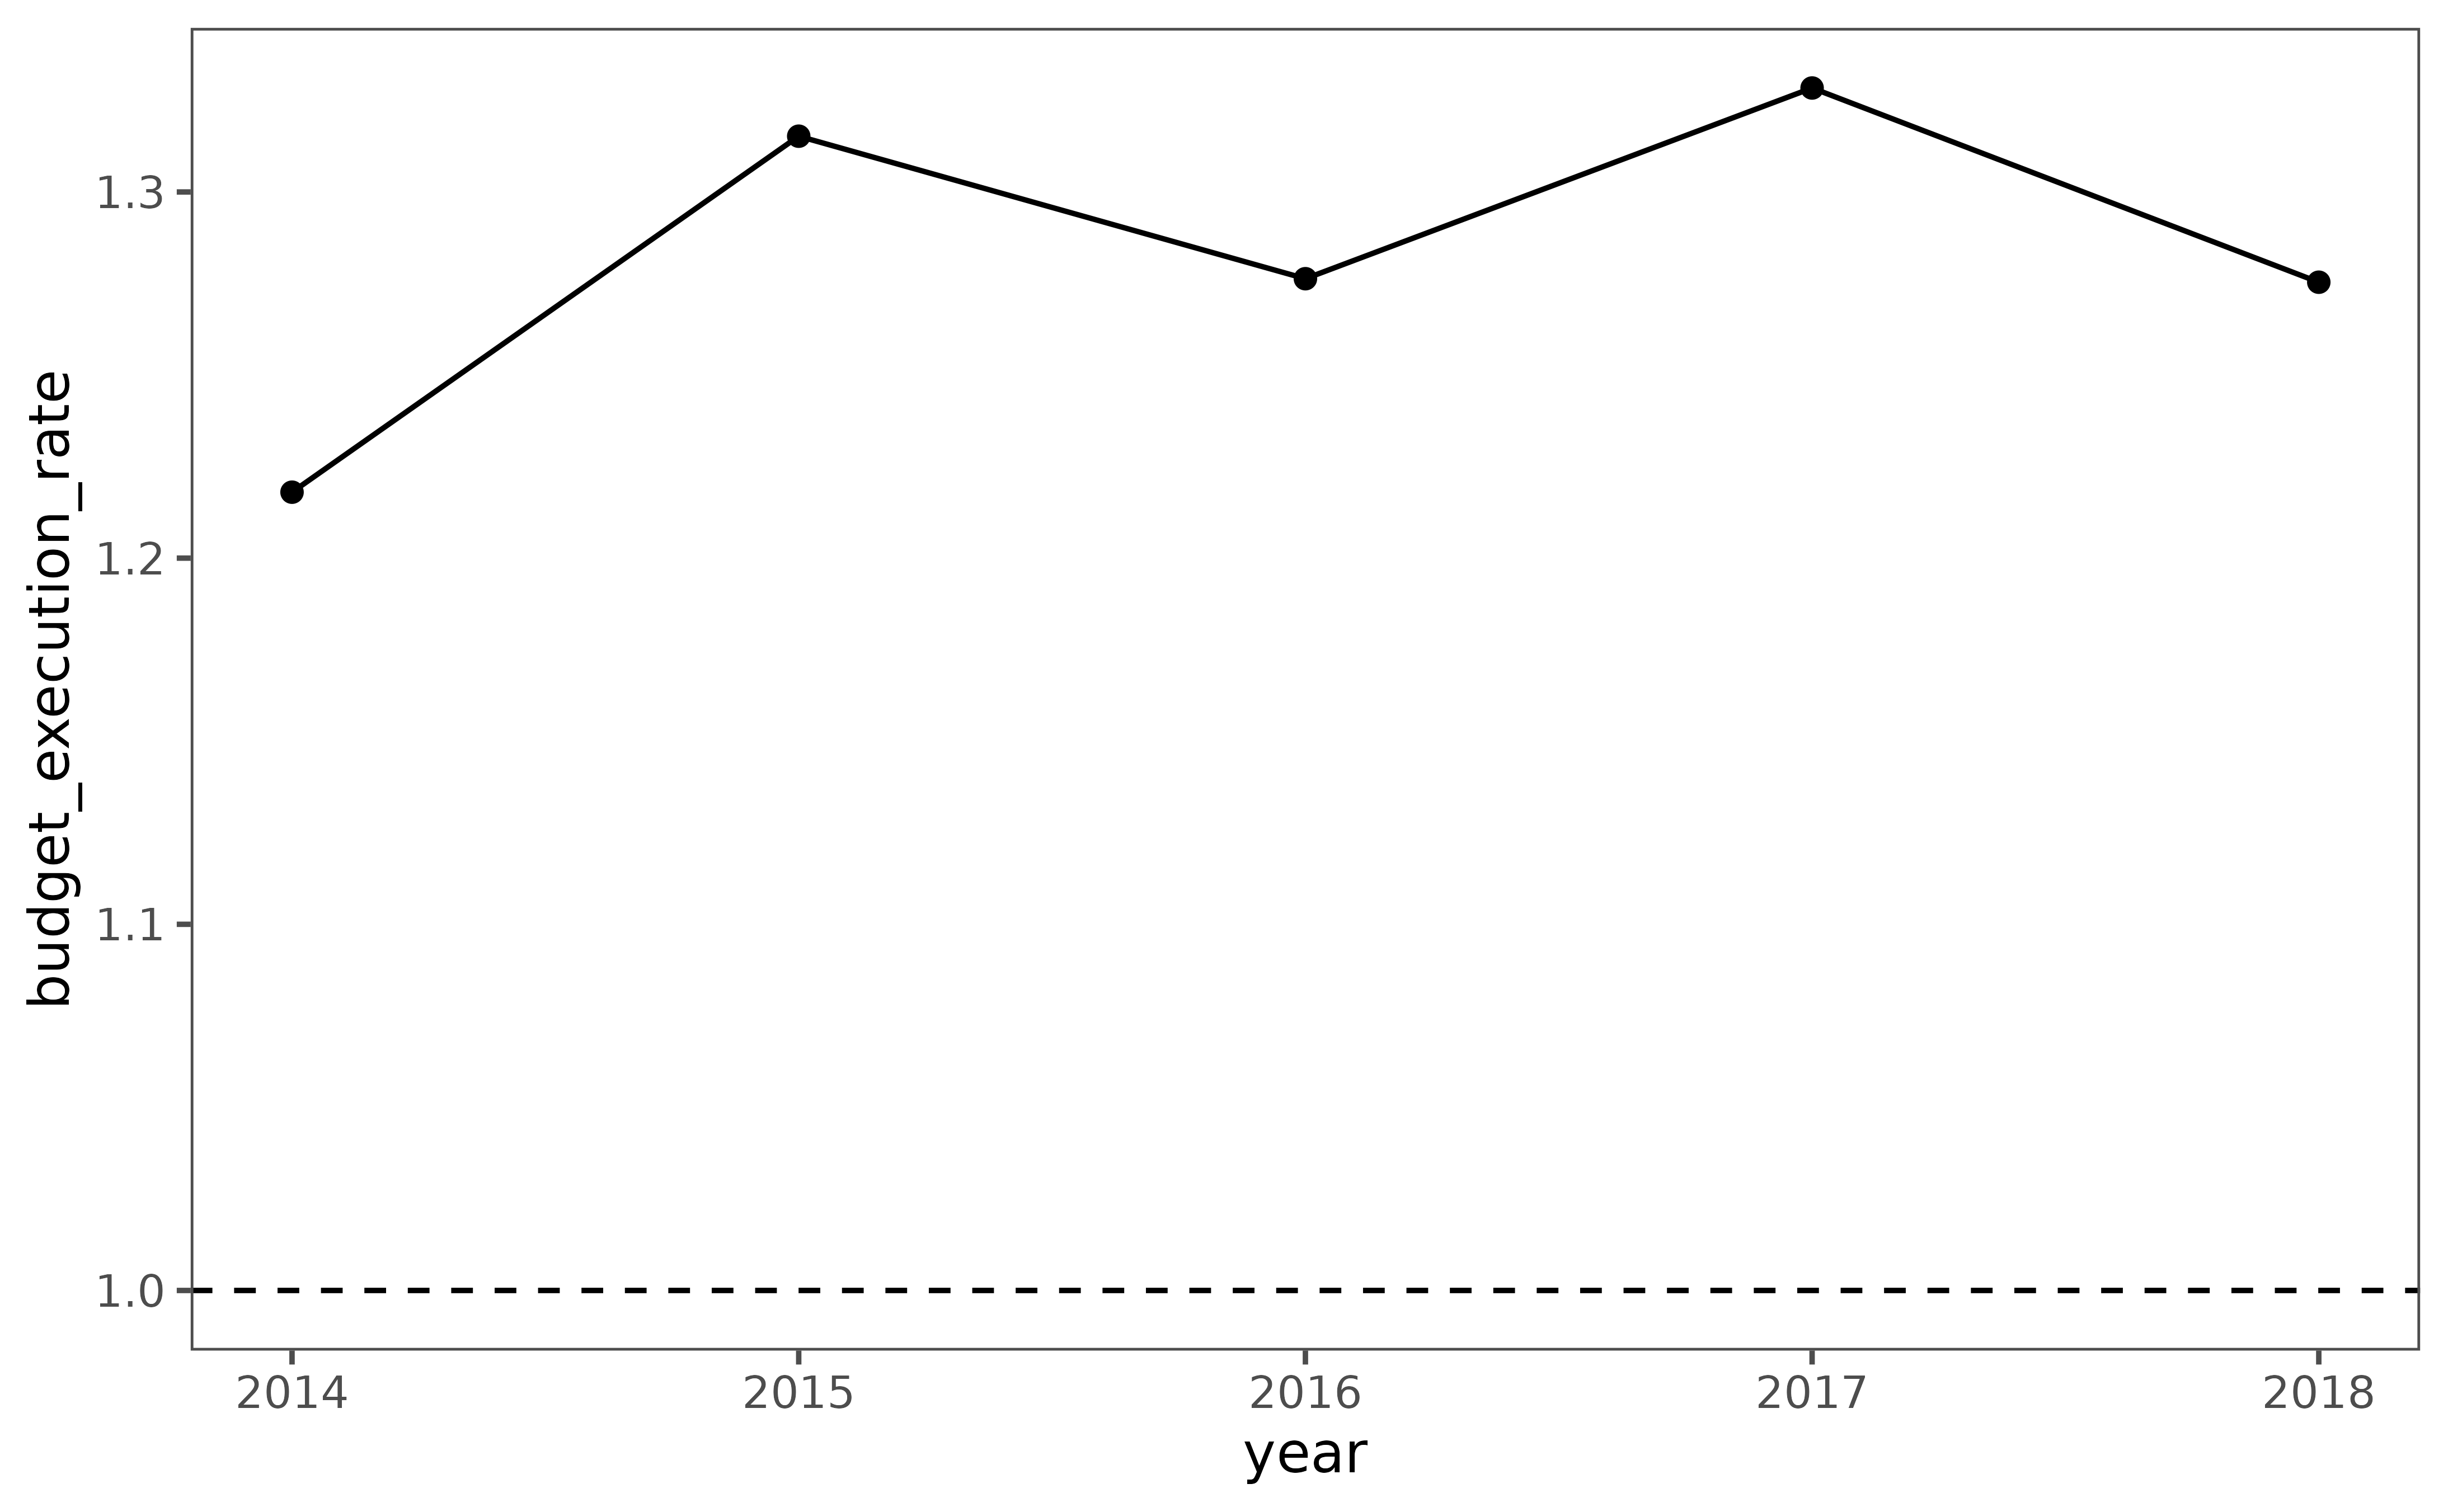
Wage bill ceilings are effective only when ministries must adhere to them, which depends on how ceilings are defined, how much reallocation flexibility agencies have, and the strength of oversight. Large gaps between budgeted and actual wage spending, or between authorized and filled positions, indicate weak control. Robust payroll–HR systems are essential to prevent ghost workers and illegal payments. Where such control systems are absent, payroll audits, employee censuses, and electronic payment systems help strengthen control and reduce salary arrears.
Guidance questions for the assessment:
- Are wage bill ceilings set by the Ministry of Finance adhered to by
line ministries?
- Are ceilings set based on positions or actual personnel?
- Do ministries agencies have discretion in spending the savings from vacant positions?
- If agencies have flexibility in reappropriations from payroll to other expenditures, are these being done transparently?
- How effective are payroll controls as measured by PEFA indicator
PI-23?
- Integration of personnel and payroll records
- Management of payroll changes
- Internal control of payroll
- Use of payroll audits
- Is there a high incidence of ghost workers? What are the reasons for these workers being on the payroll (fake workers, retirees still on the payroll, or legitimate employees getting illegal pay)? Has a payroll audit been conducted to identify issues?
- Is there are problem of salary arrears and delays in the payment of salaries for public servants
3.2.1. Deviations between budgeted and actual general government wage bill expenditures
3.2.2. Filled positions as a proportion of budgeted positions
3.2.3. Ghost workers as a percentage of total workers
3.2.3. Wage bill arrears as a percentage of total wage bill expenditures
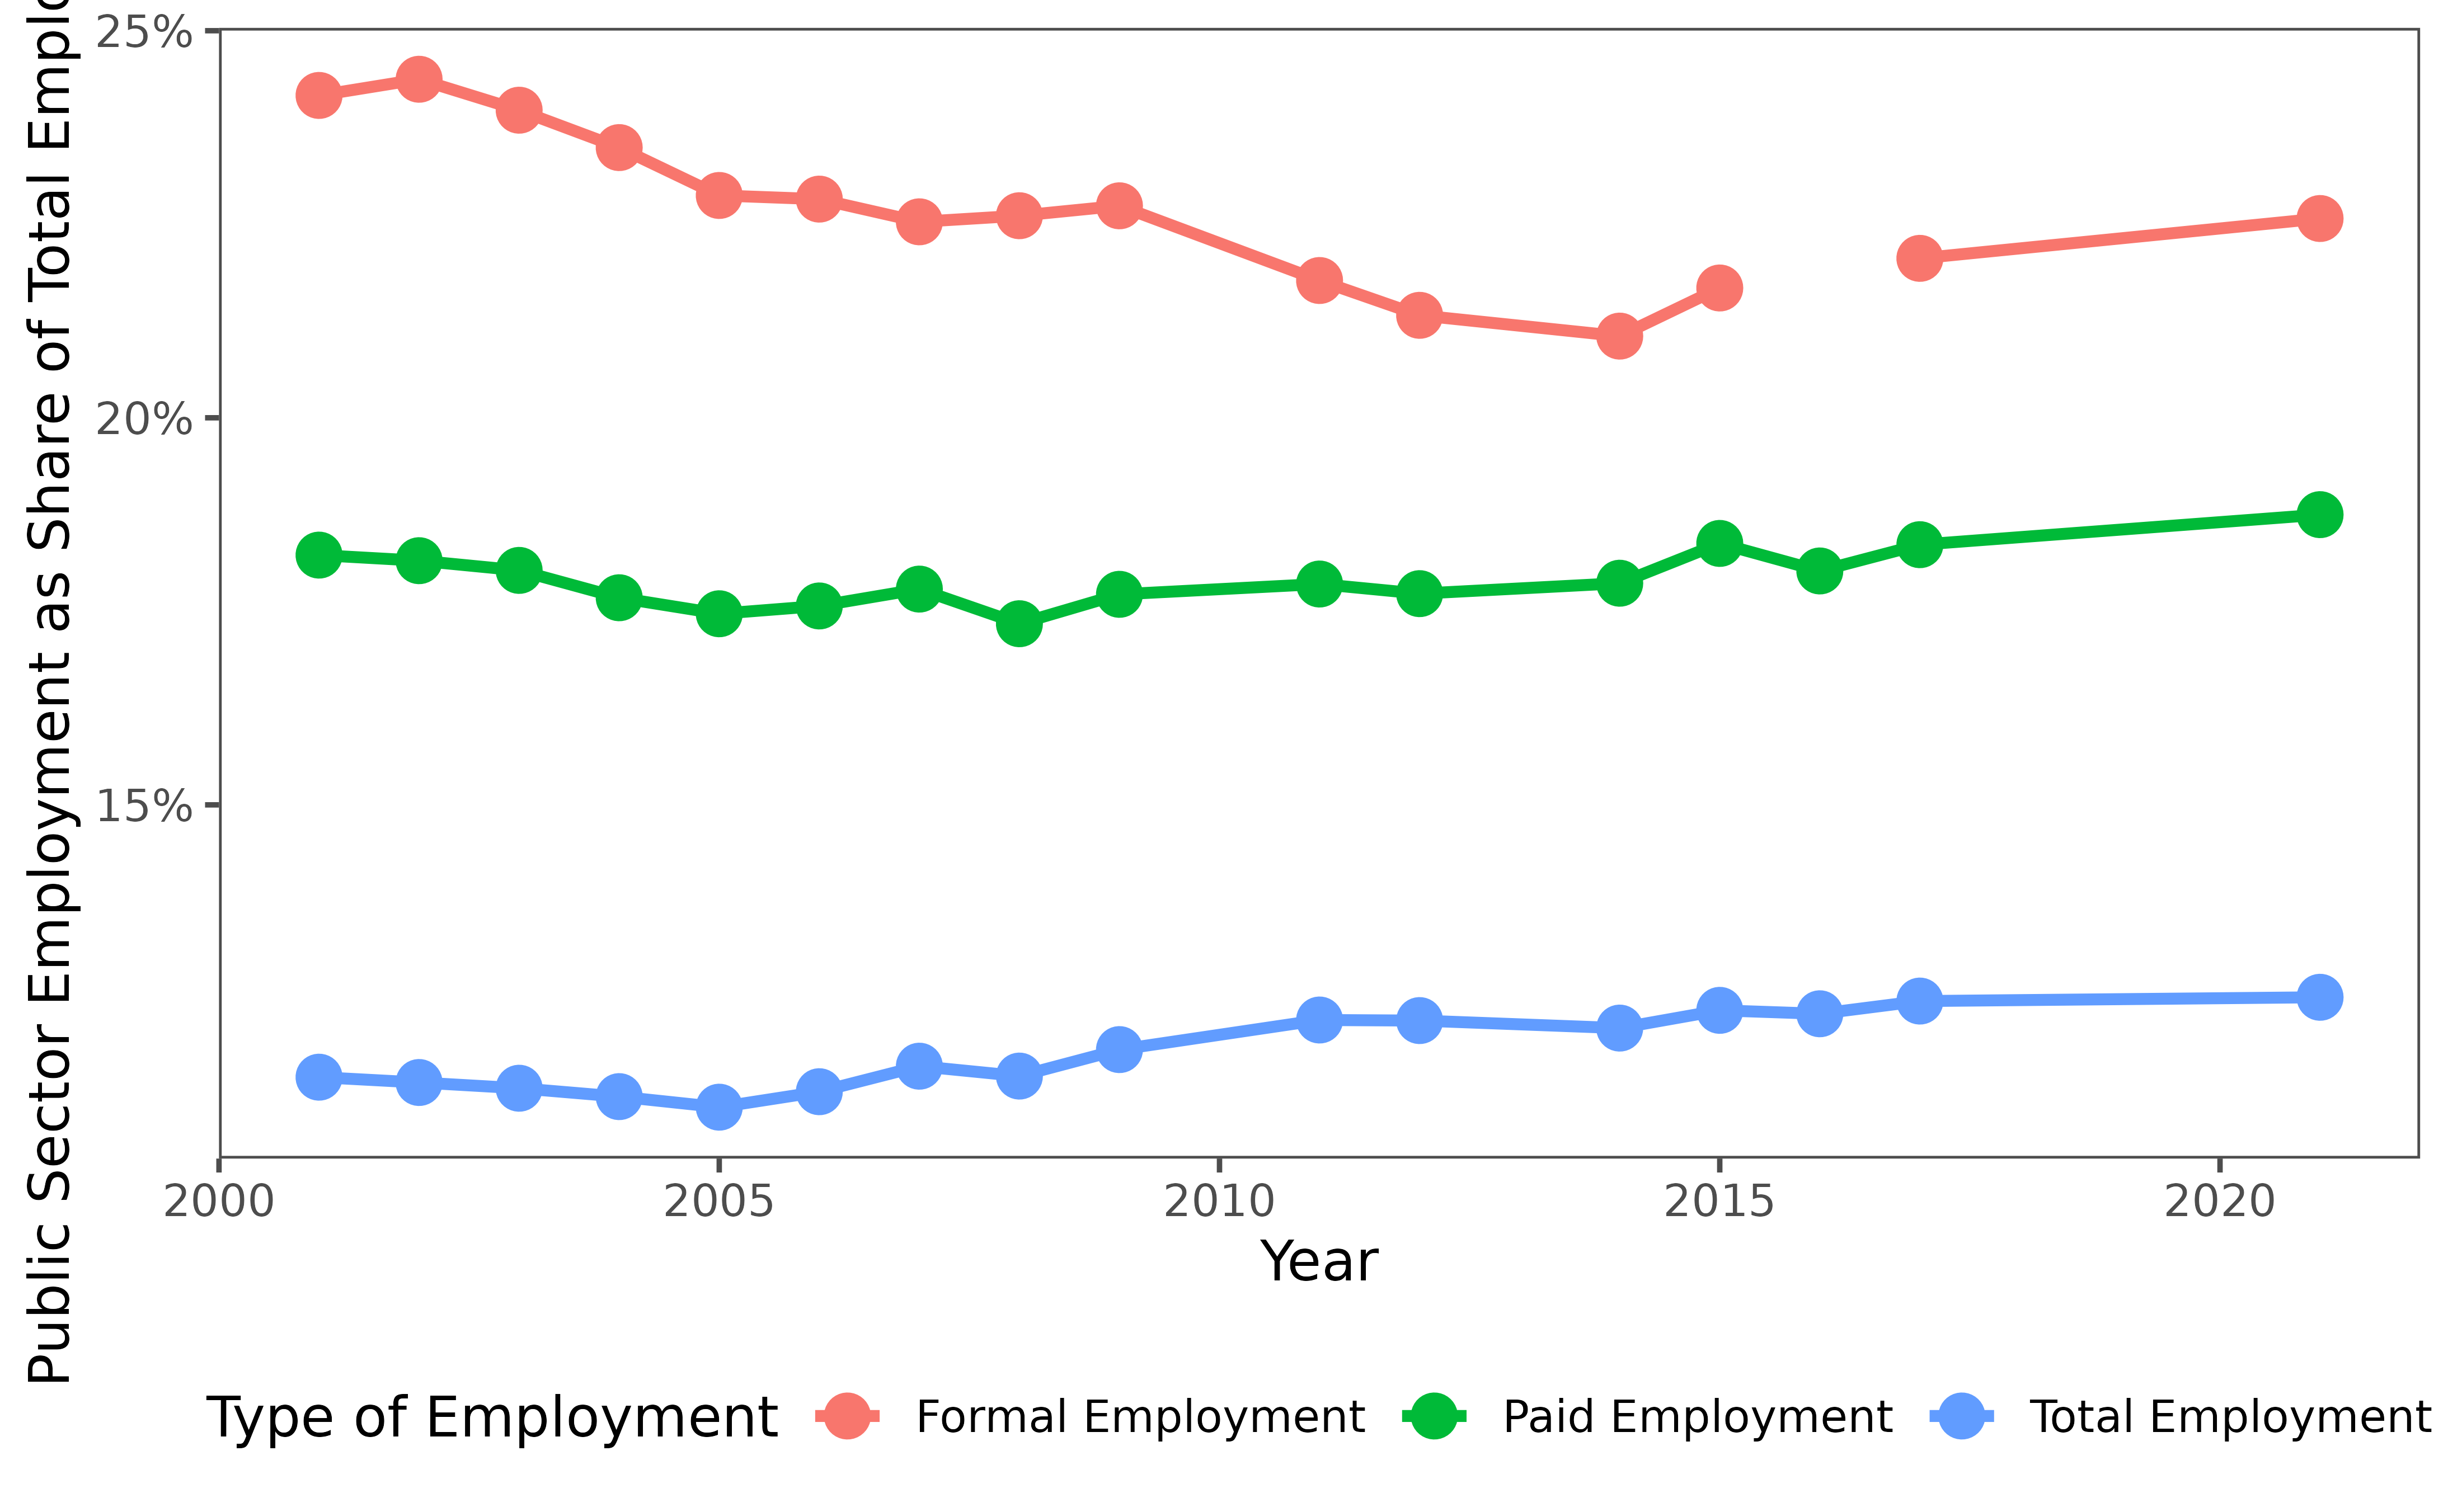
This section assesses whether a public sector is over- or under-staffed by comparing public employment to total, paid, and formal-sector employment. Globally, the public sector accounts on average for about 16% of total employment, 30% of wage employment and 37% of formal-sector wage employment — though there is wide cross-country variation, with public-sector shares ranging from under 2% to over 40%. The share of public sector employment tends to rise with a country’s income level, reflecting greater government roles as economies develop, but there is no clear relationship between income and the share of salaried employment that is public — implying that public and private formal wage employment often expand together. The analysis of employment distribution should also examine whether the right number of staff are employed in the right functions, locations, and sectors — to ensure efficiency and avoid distortions.
Guidance questions for the assessment:
- Is the public sector over- or understaffed in aggregate and what have been the employment trends over time?
- Is the public sector over- or understaffed for particular skills and occupations, both in aggregate and in specific organizational and territorial jurisdictions?
- Are there a large proportion of public sector workers with low educational qualifications or in low-skilled jobs?
- Is the public sector a gender-equal employer?
- What are the proportion of women in aggregate?
- Is there horizontal and vertical segregation in employment?
- Is there a dual labor regime with a large segment of contract workers, and what are its implications for public sector employment?
3.3.1. Public sector employment as a share of total, paid, and formal employment
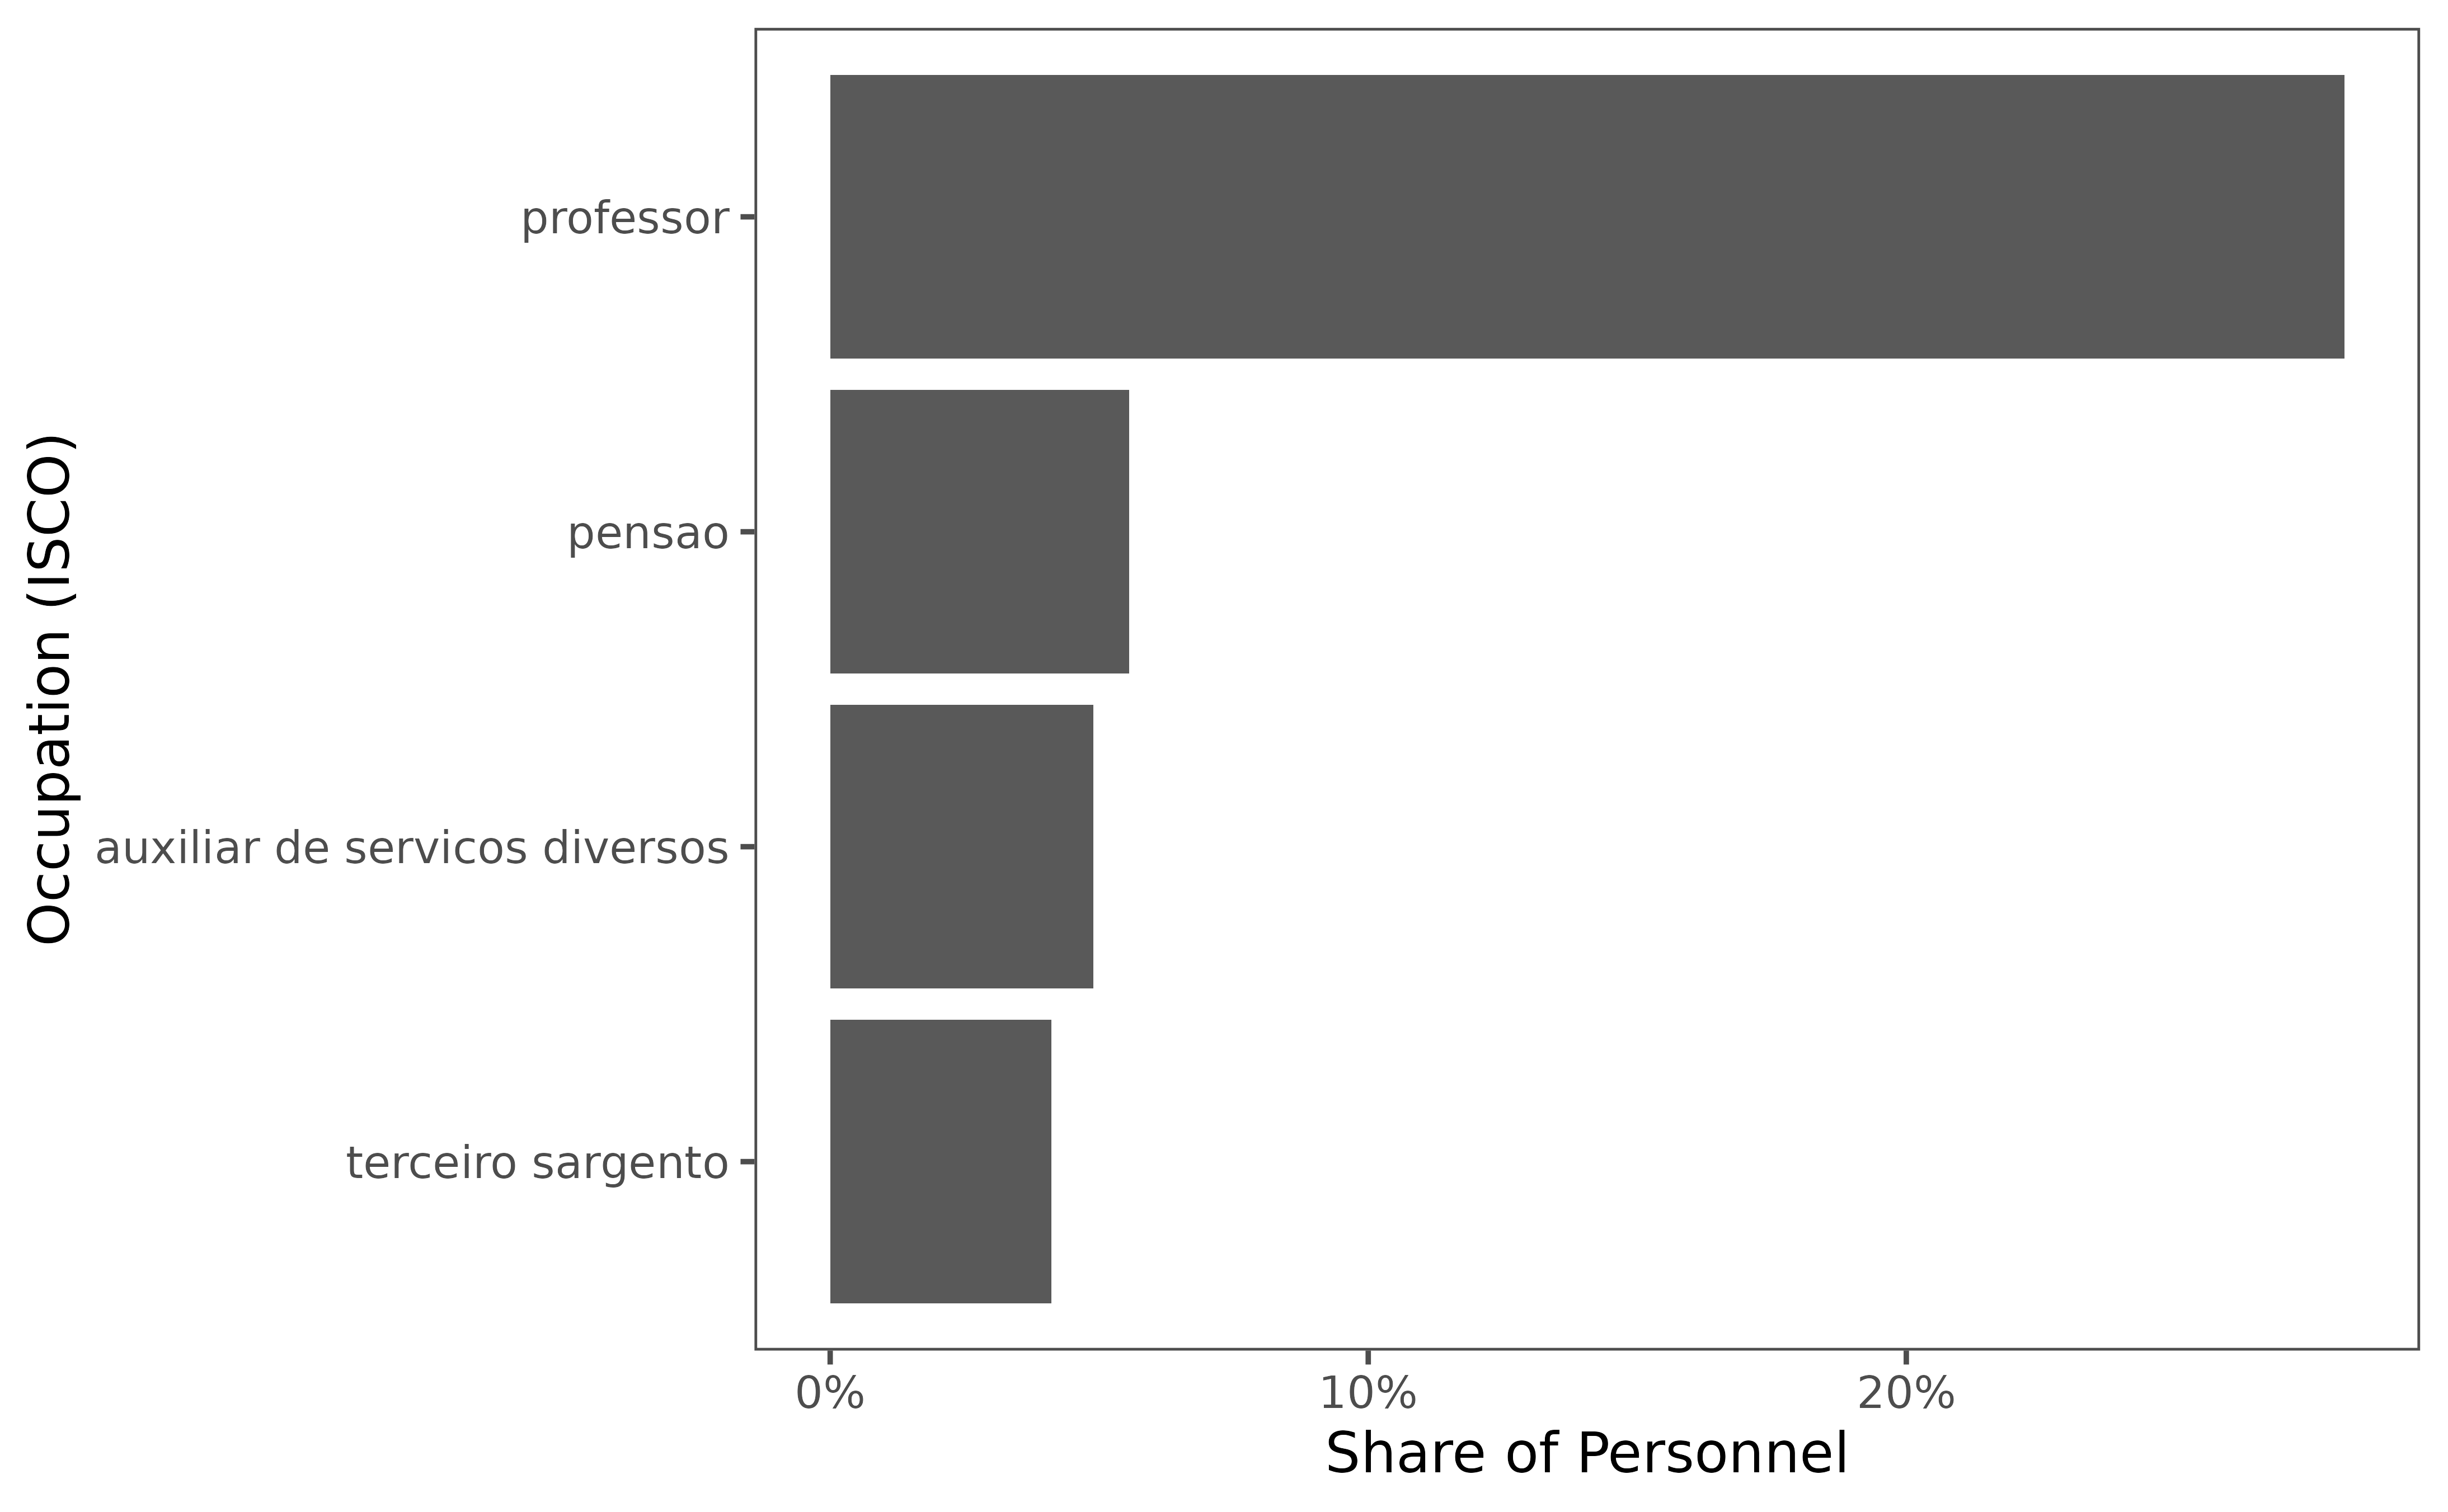
3.3.2. Industry and occupational distribution of public sector employment
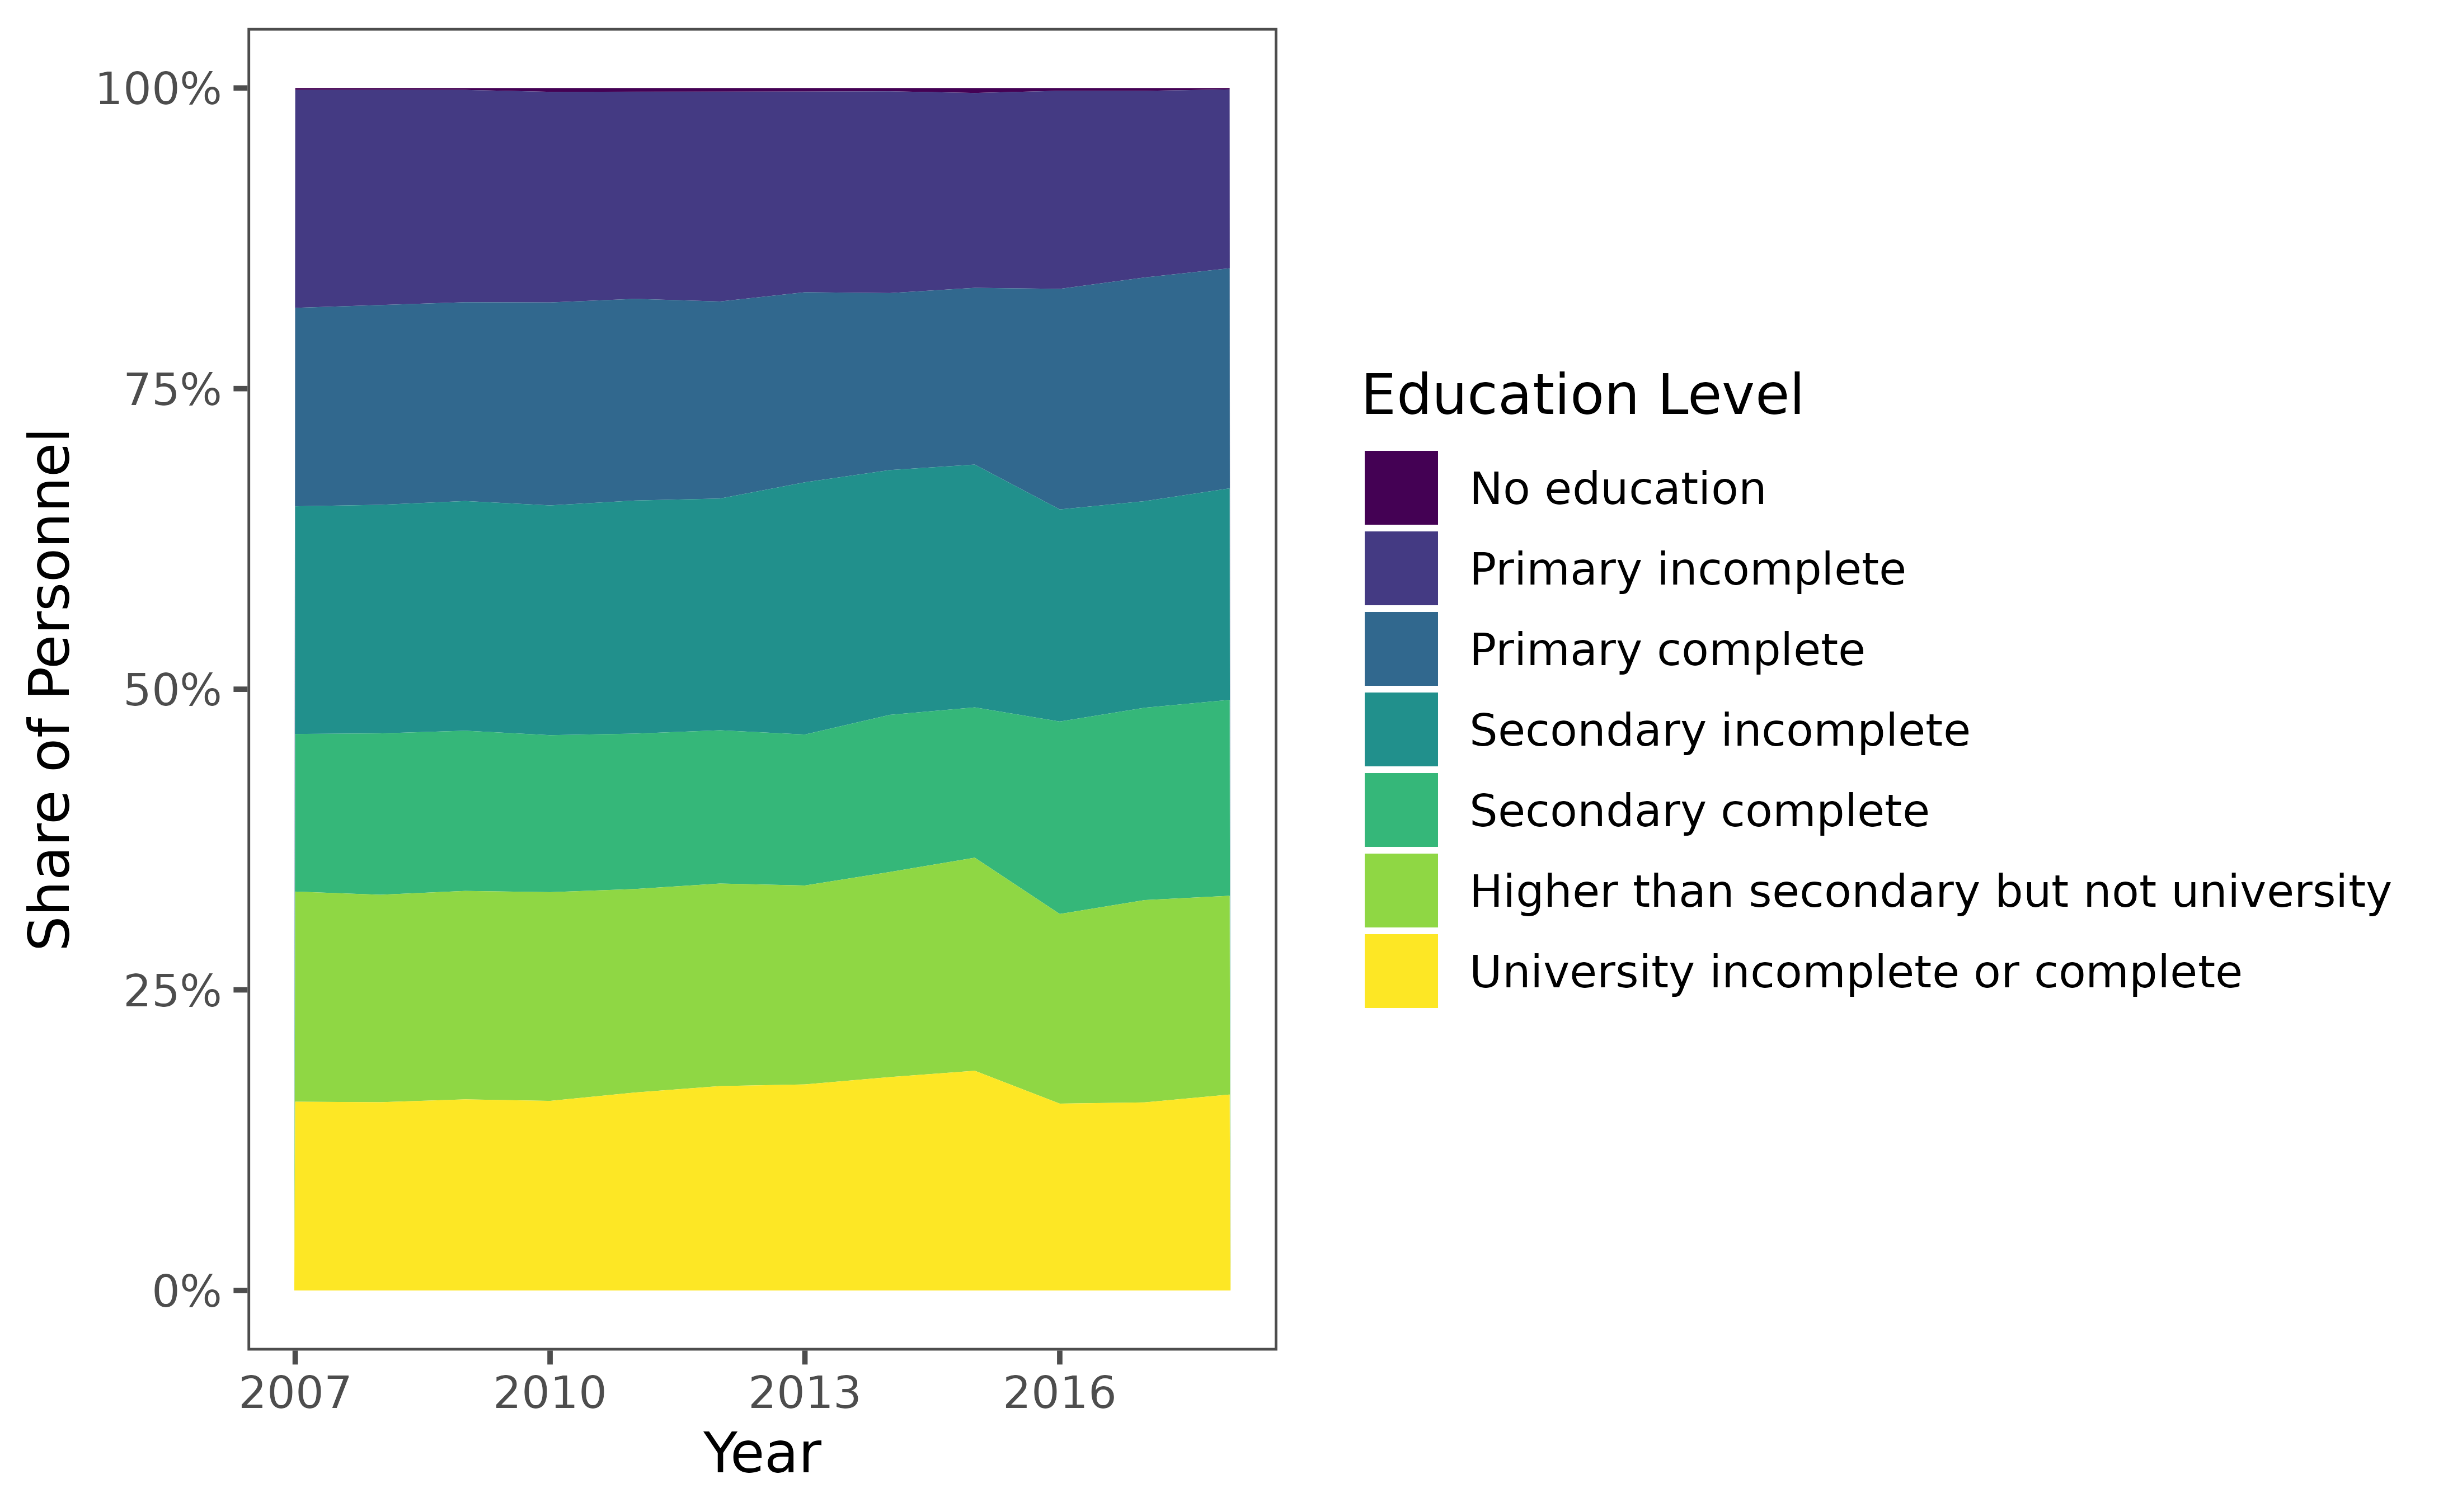
3.3.3. Educational profile of public sector employees
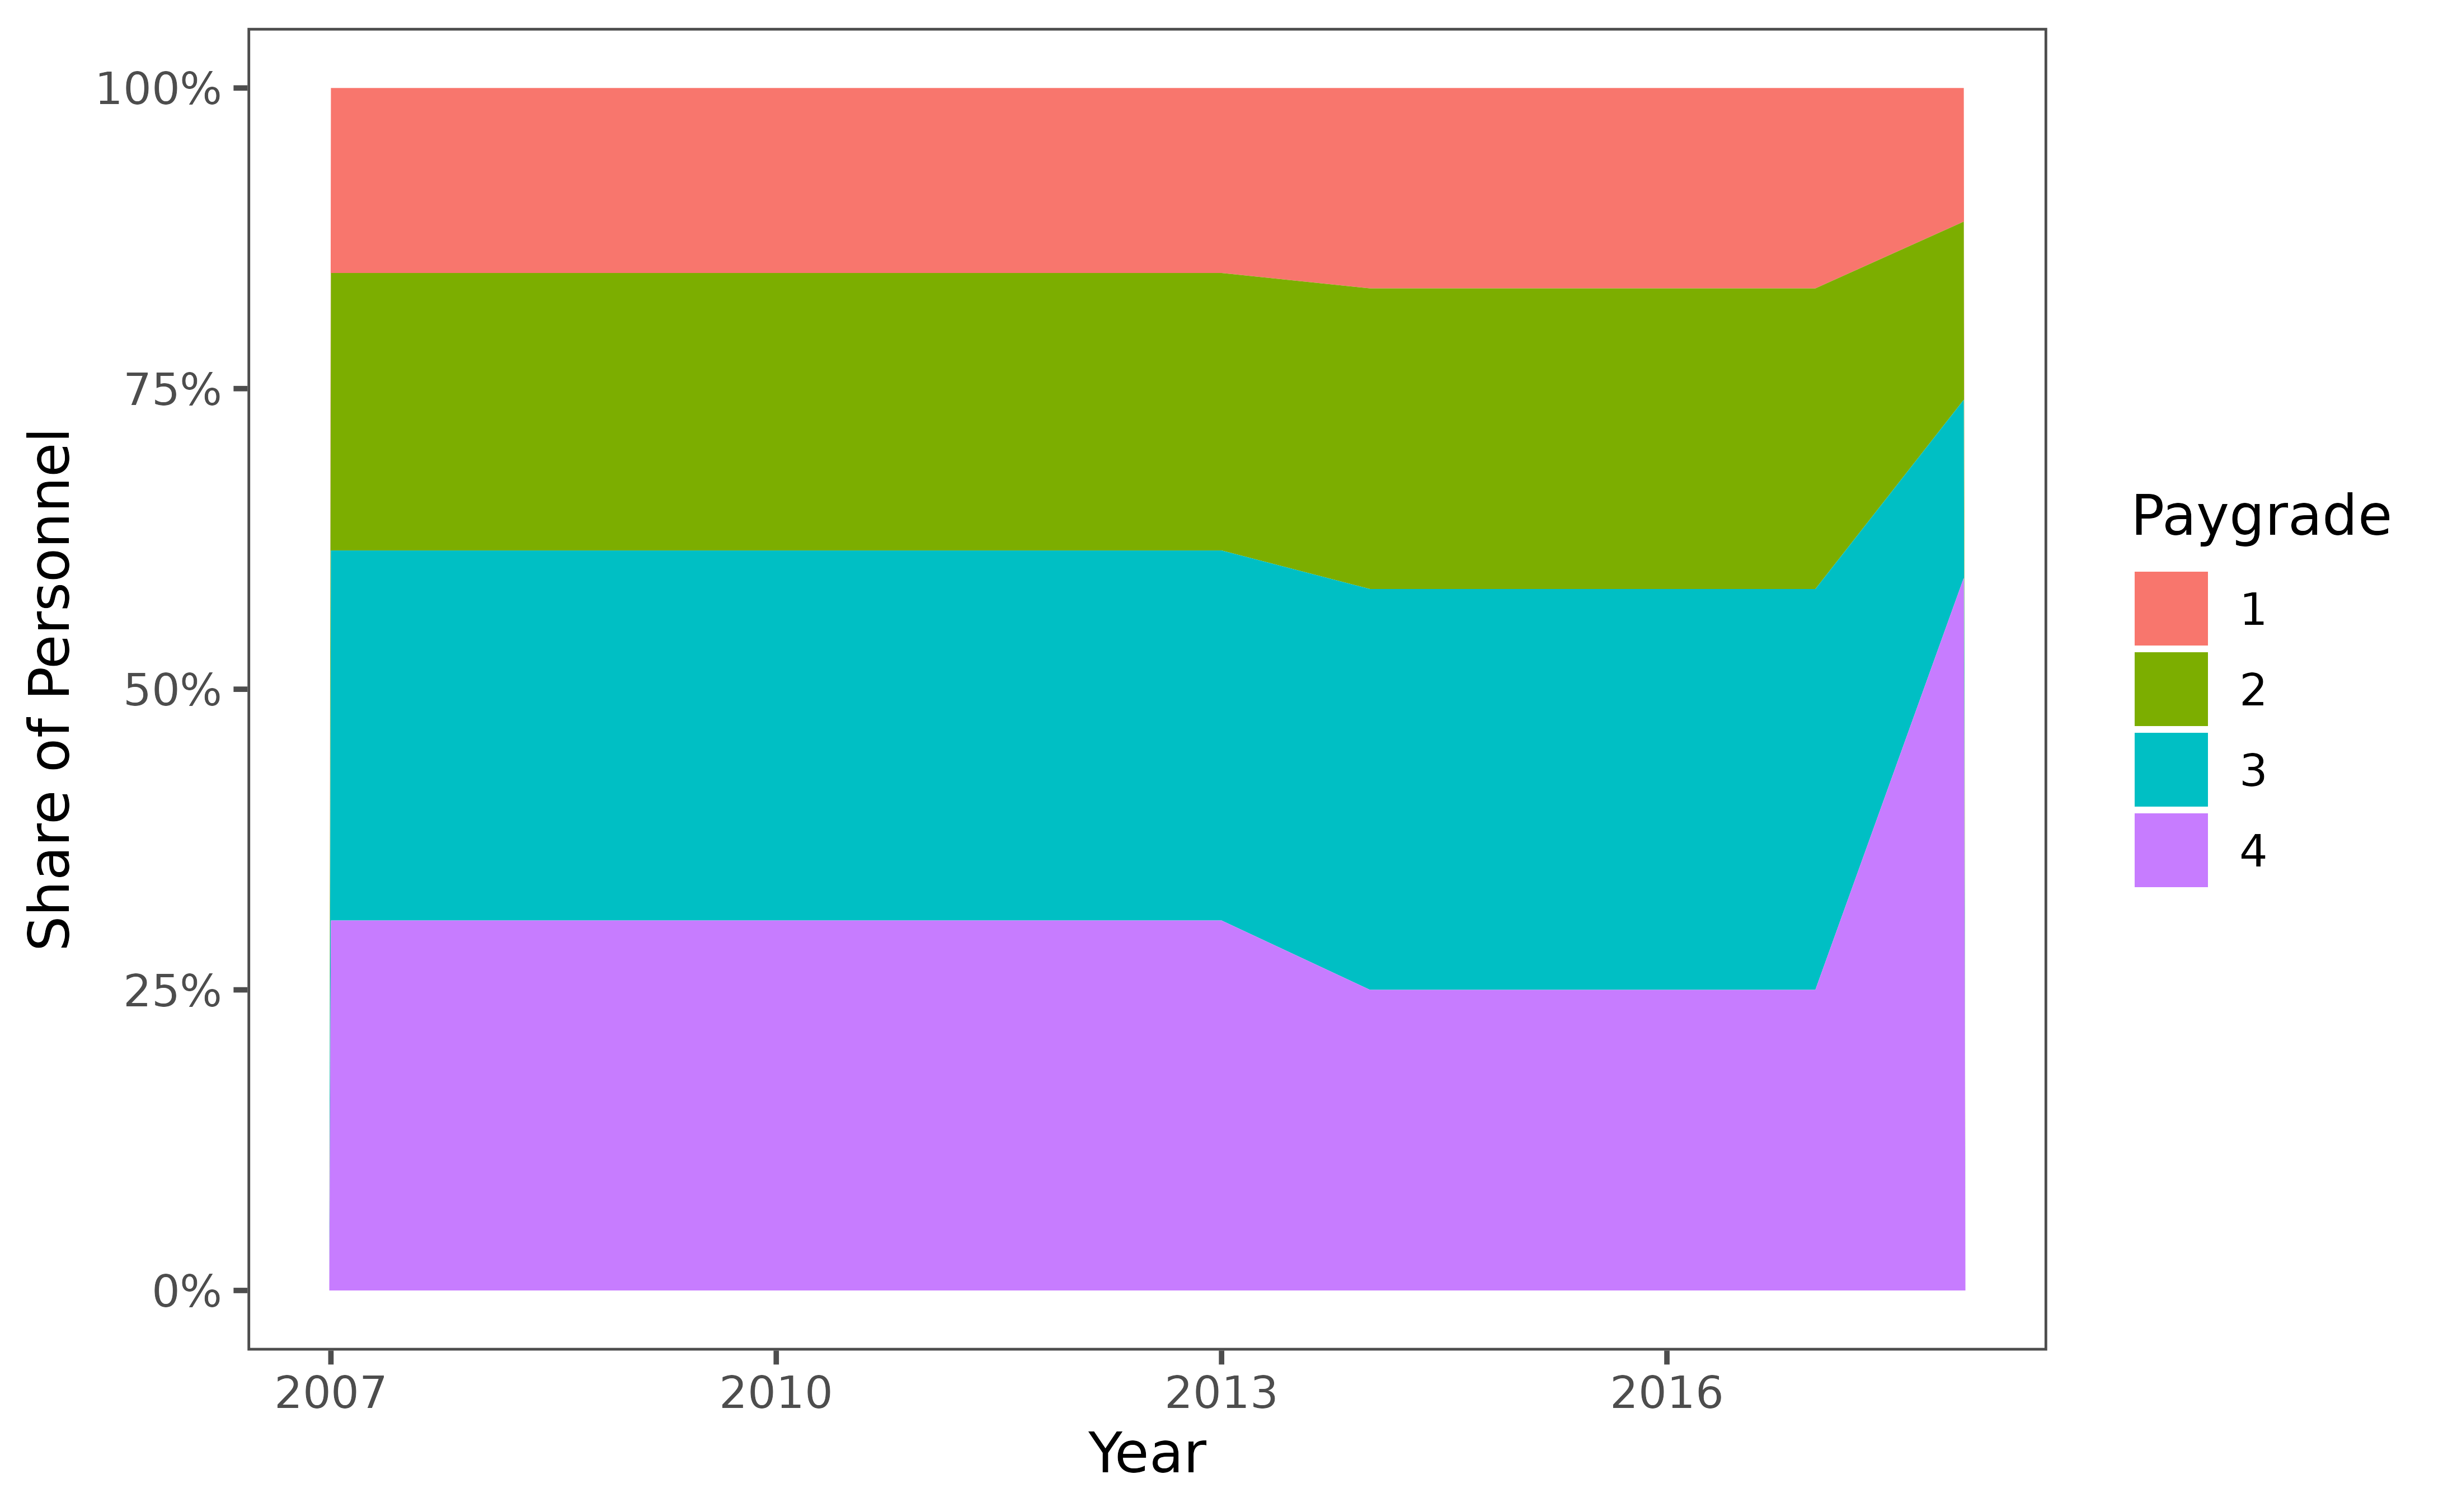
3.3.4. Distribution of public sector workers by pay grade
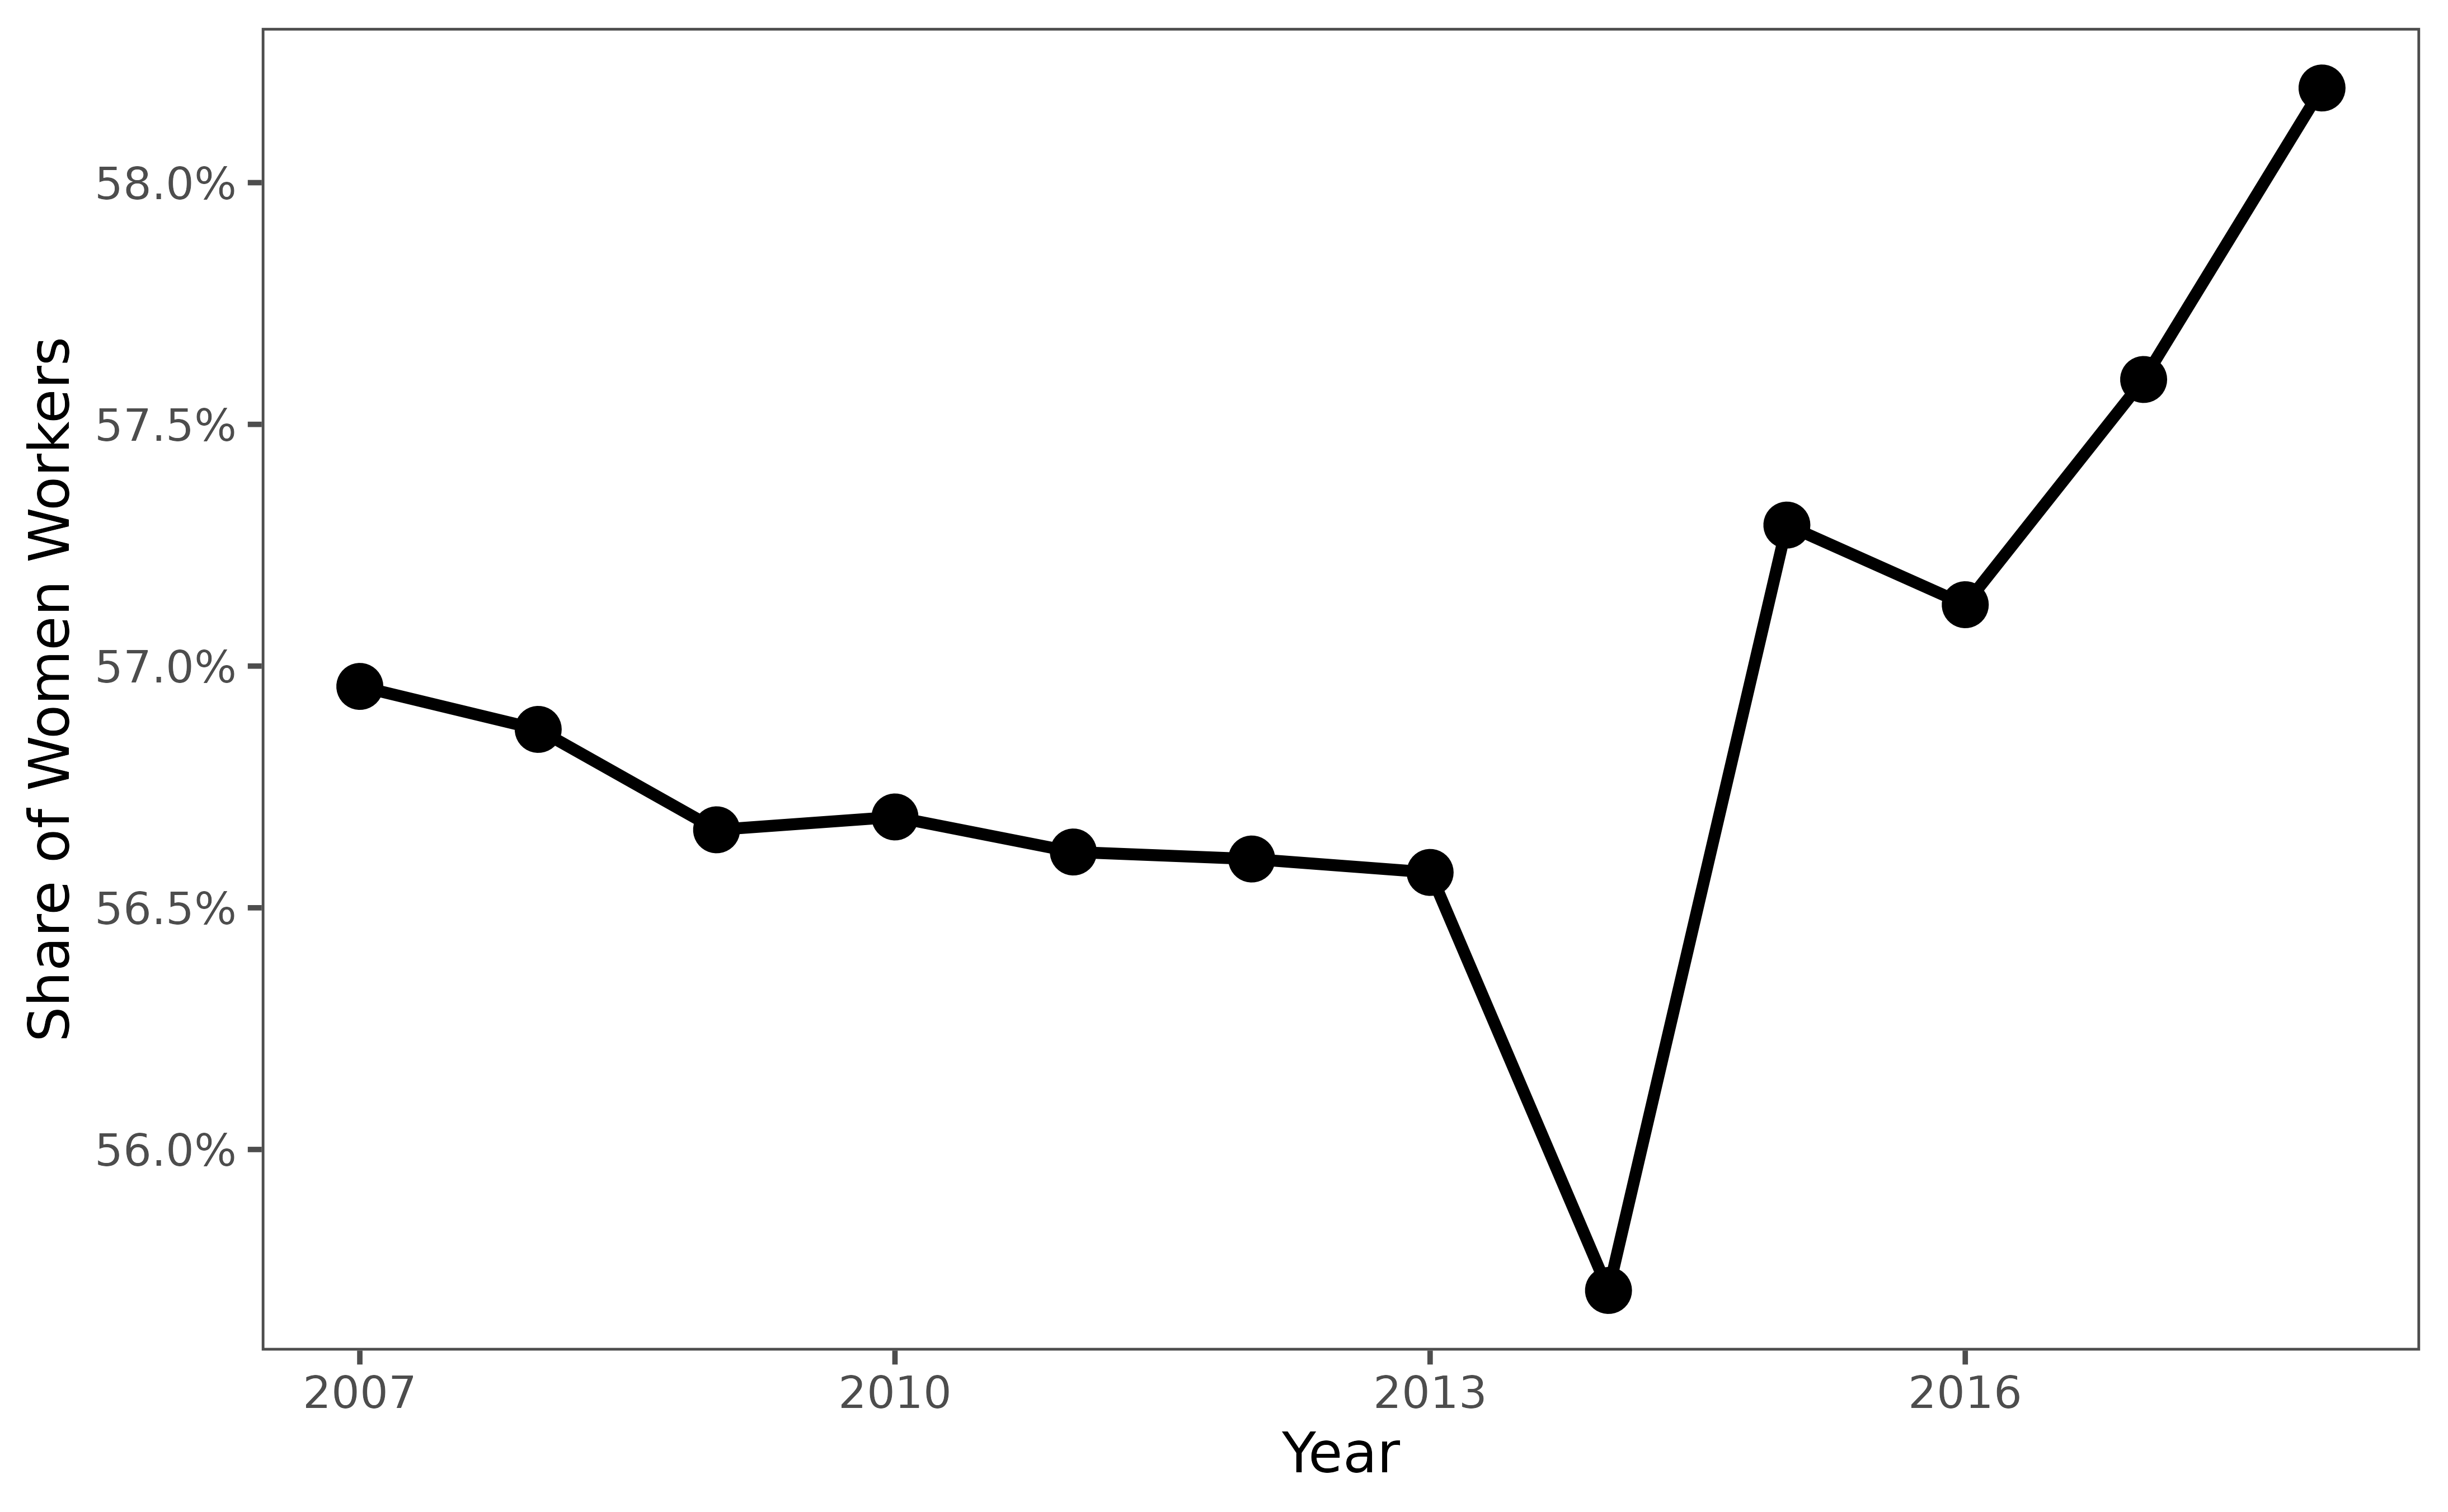
3.3.5. Share of women workers in the public sector
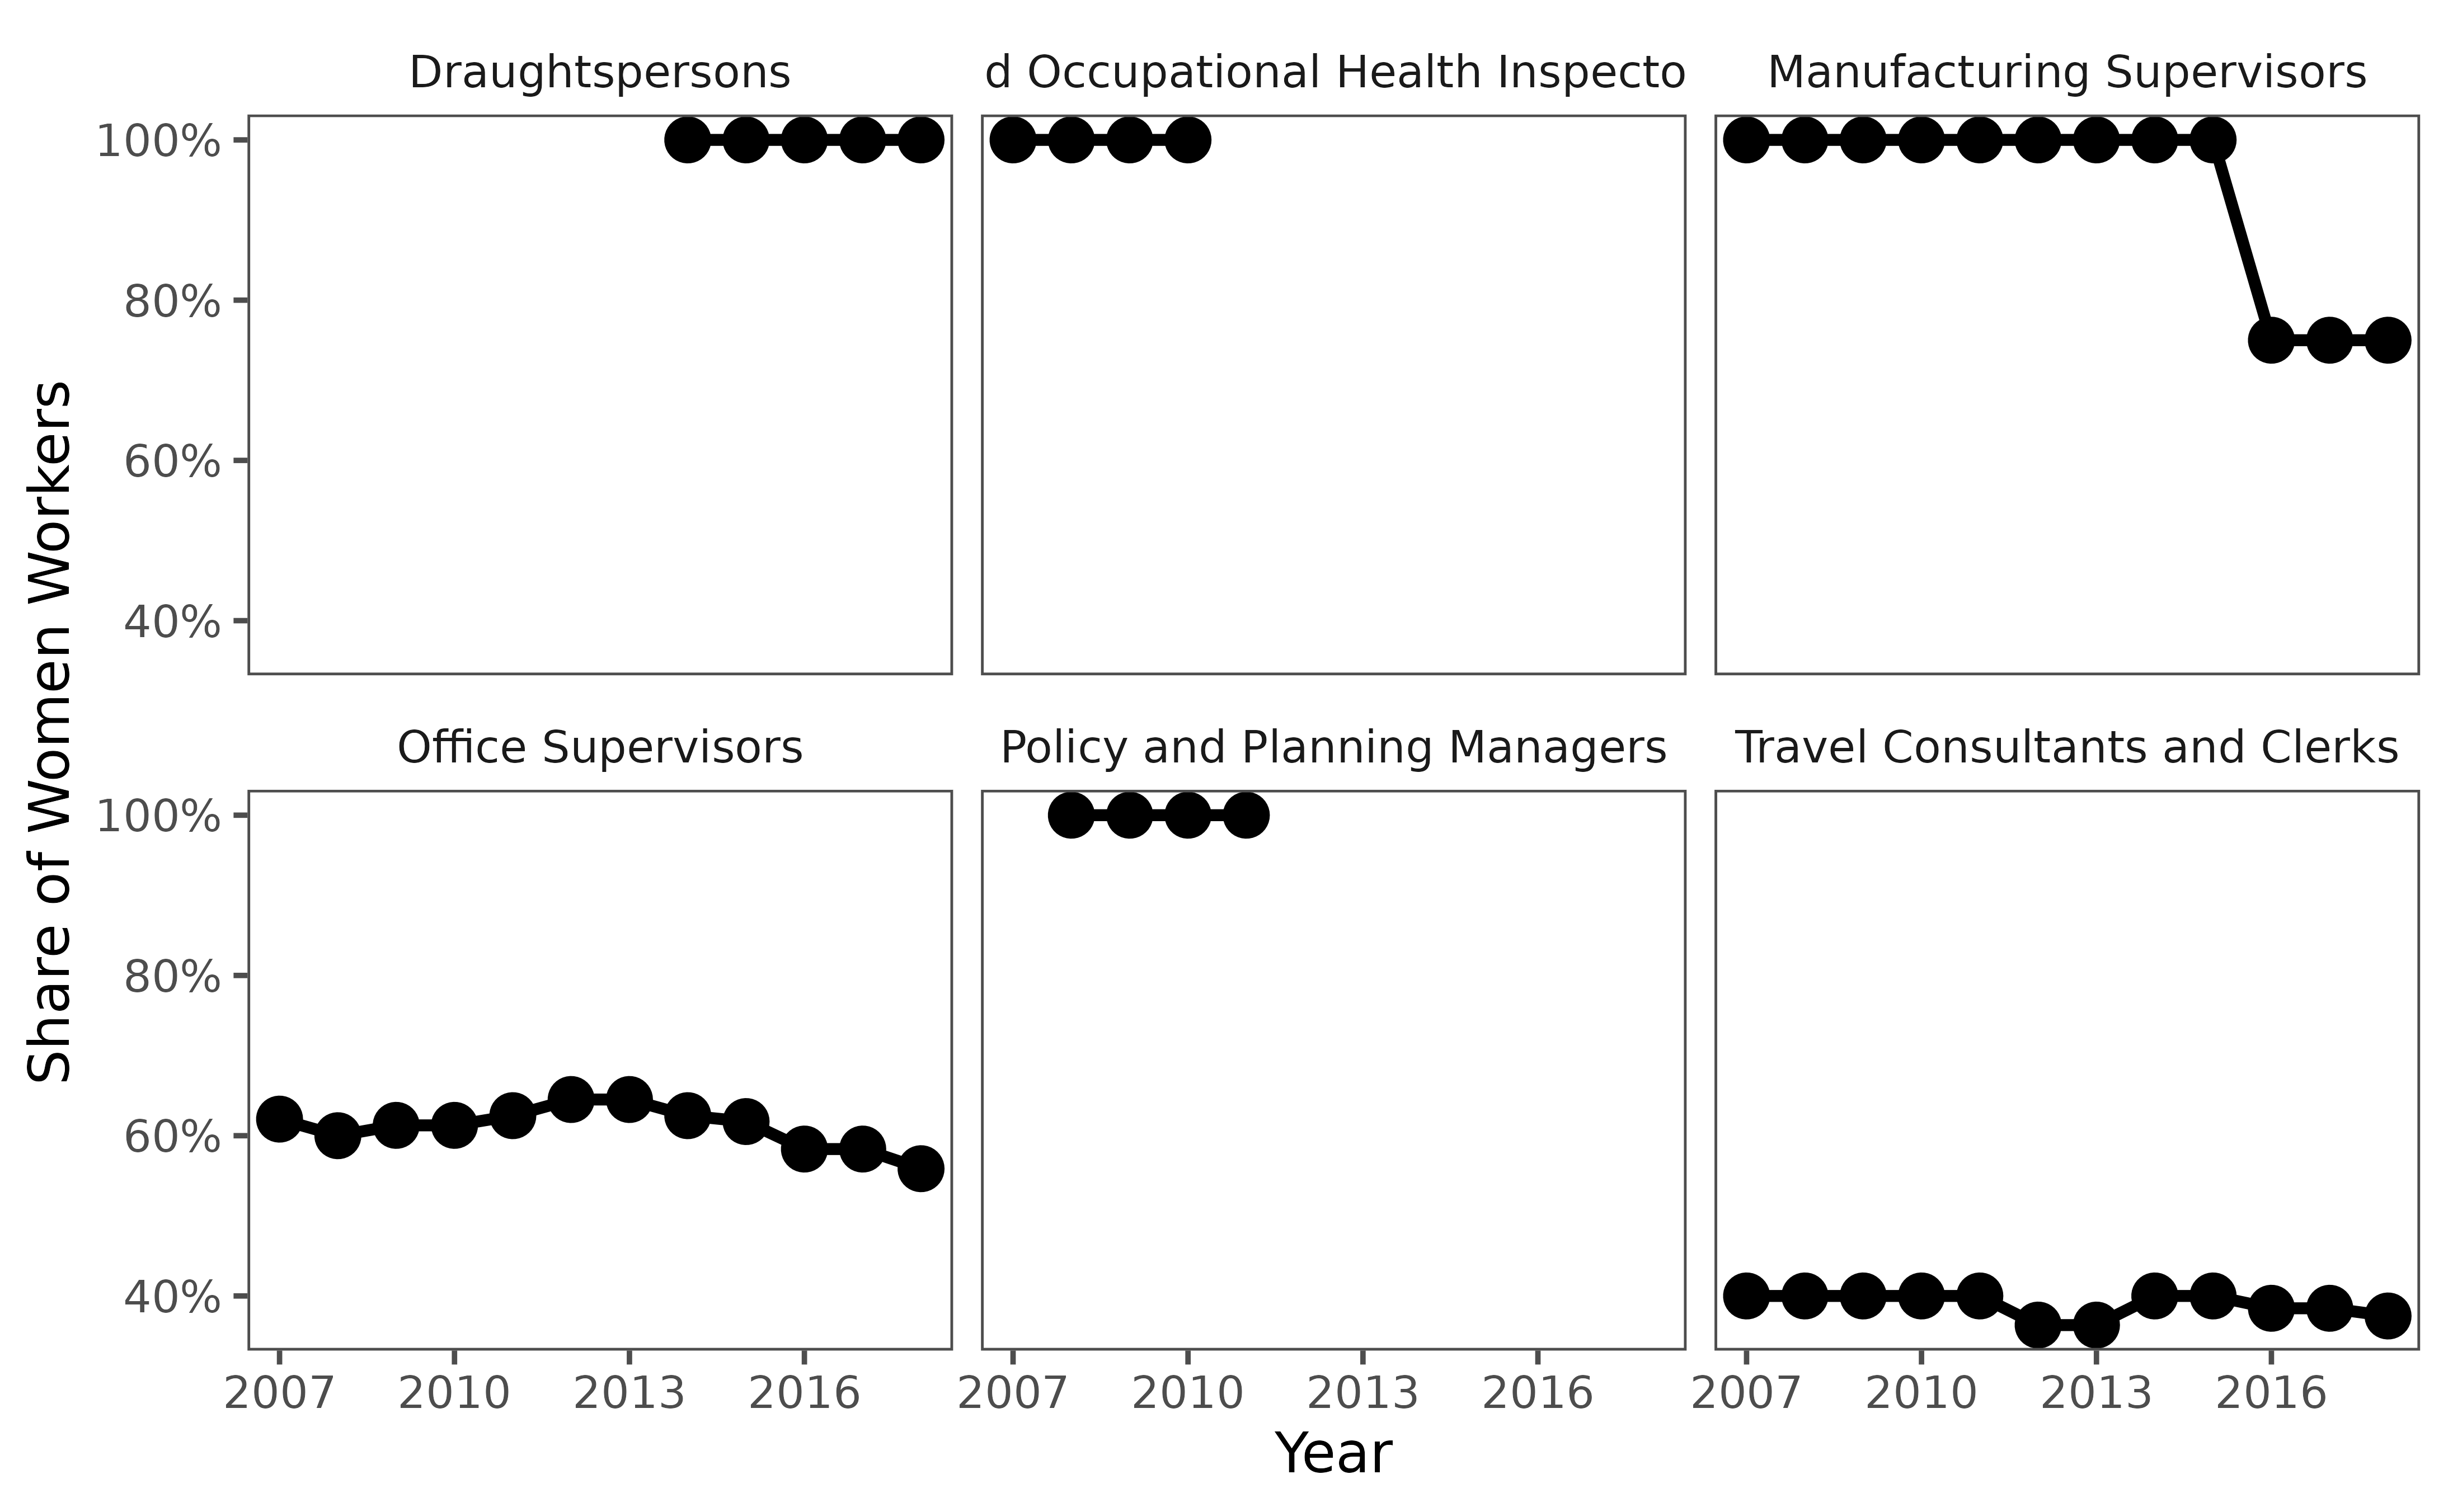
3.3.6. Share of women workers by occupation
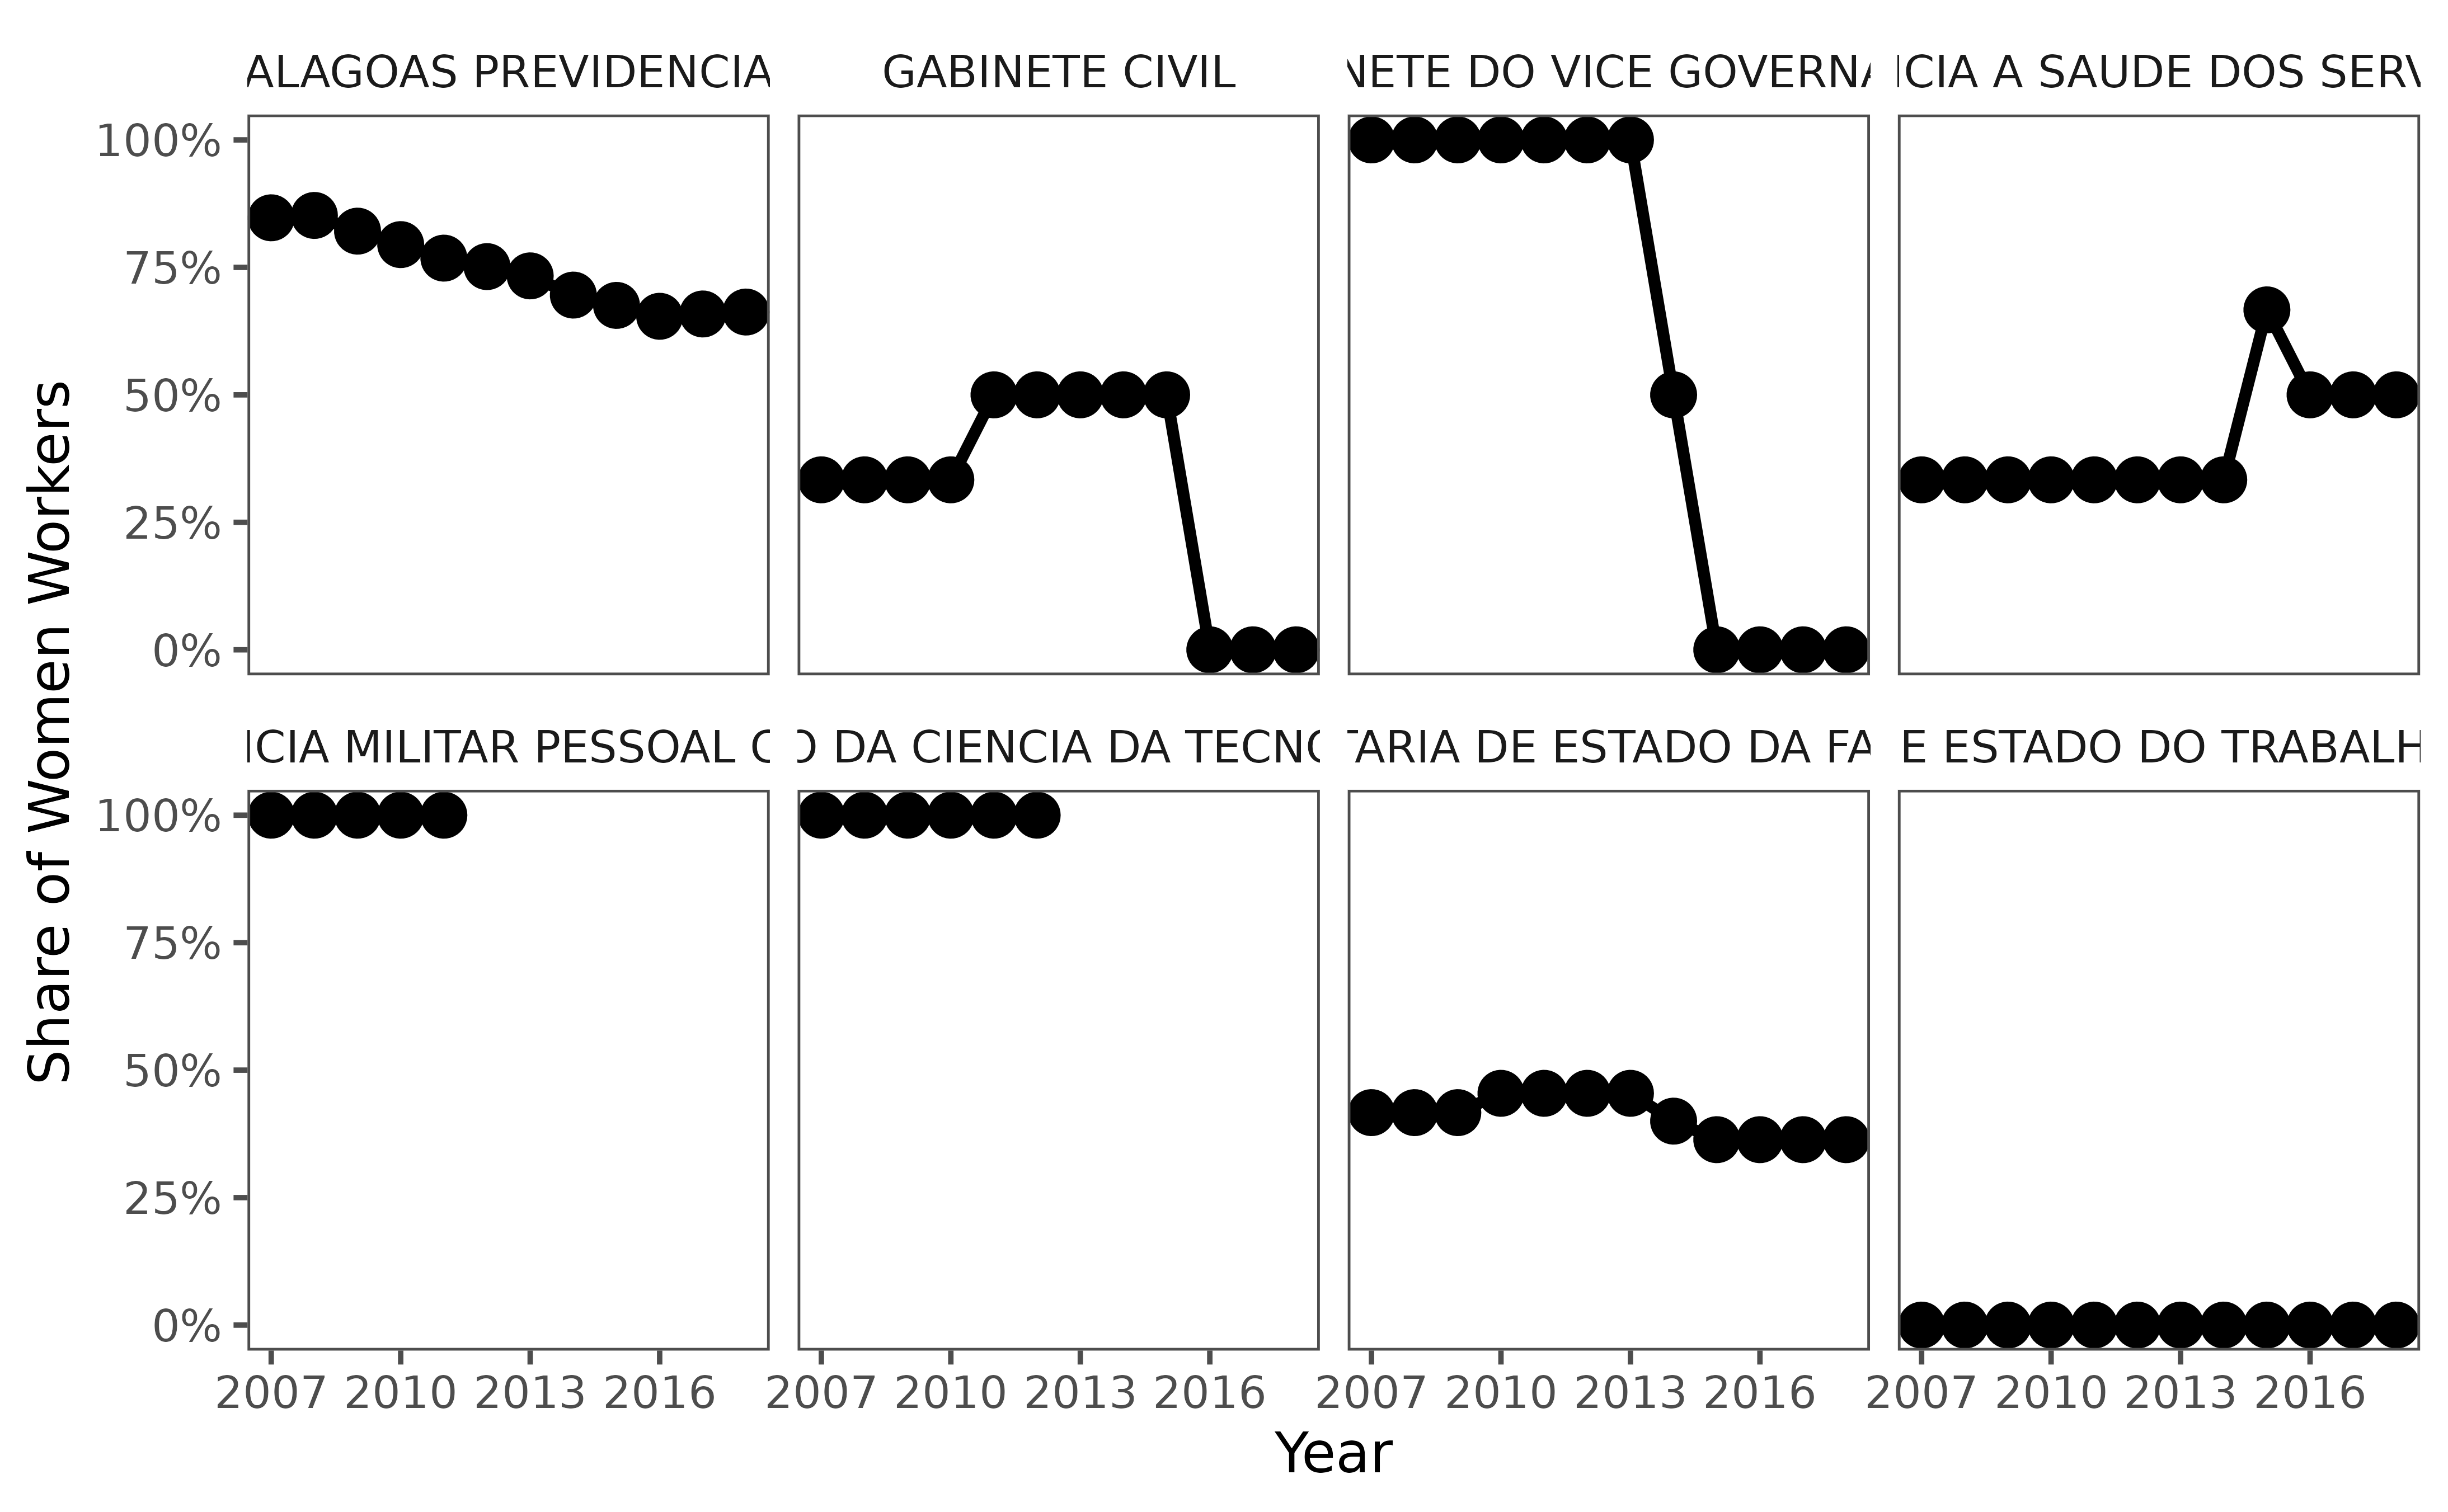
3.3.7. Share of women workers by ministry
Public sector wage levels are crucial for attracting and retaining competent workers for expenditure efficiency, fiscal sustainability, and for equilibrium outcomes in the entire labor market. This section provides some key stylized facts that provide evidence of the competitiveness of public sector wages. These include: public sector wage premiums relative to the private sector, wage levels by occupation and education level, and trends in public sector wages relative to private sector wages.
Guidance questions for the assessment:
- Does the public sector over or under-pay (taking into account all elements of compensation) compared to the private sector in aggregate and for different industries, occupations, locations, and demographic groups?
- How does pay for occupations with limited domestic private sector comparators compare to that in the public sectors of other relevant countries?
- Is there sufficient flexibility in wage practices to better align public sector wages to the needs of specific labor markets to attract specialized and high demand talent? How does this flexibility impact wage inequity and is the tradeoff well managed?
- Does the government use data to model fiscal impact and identify salary mismatches and to inform wage policy?
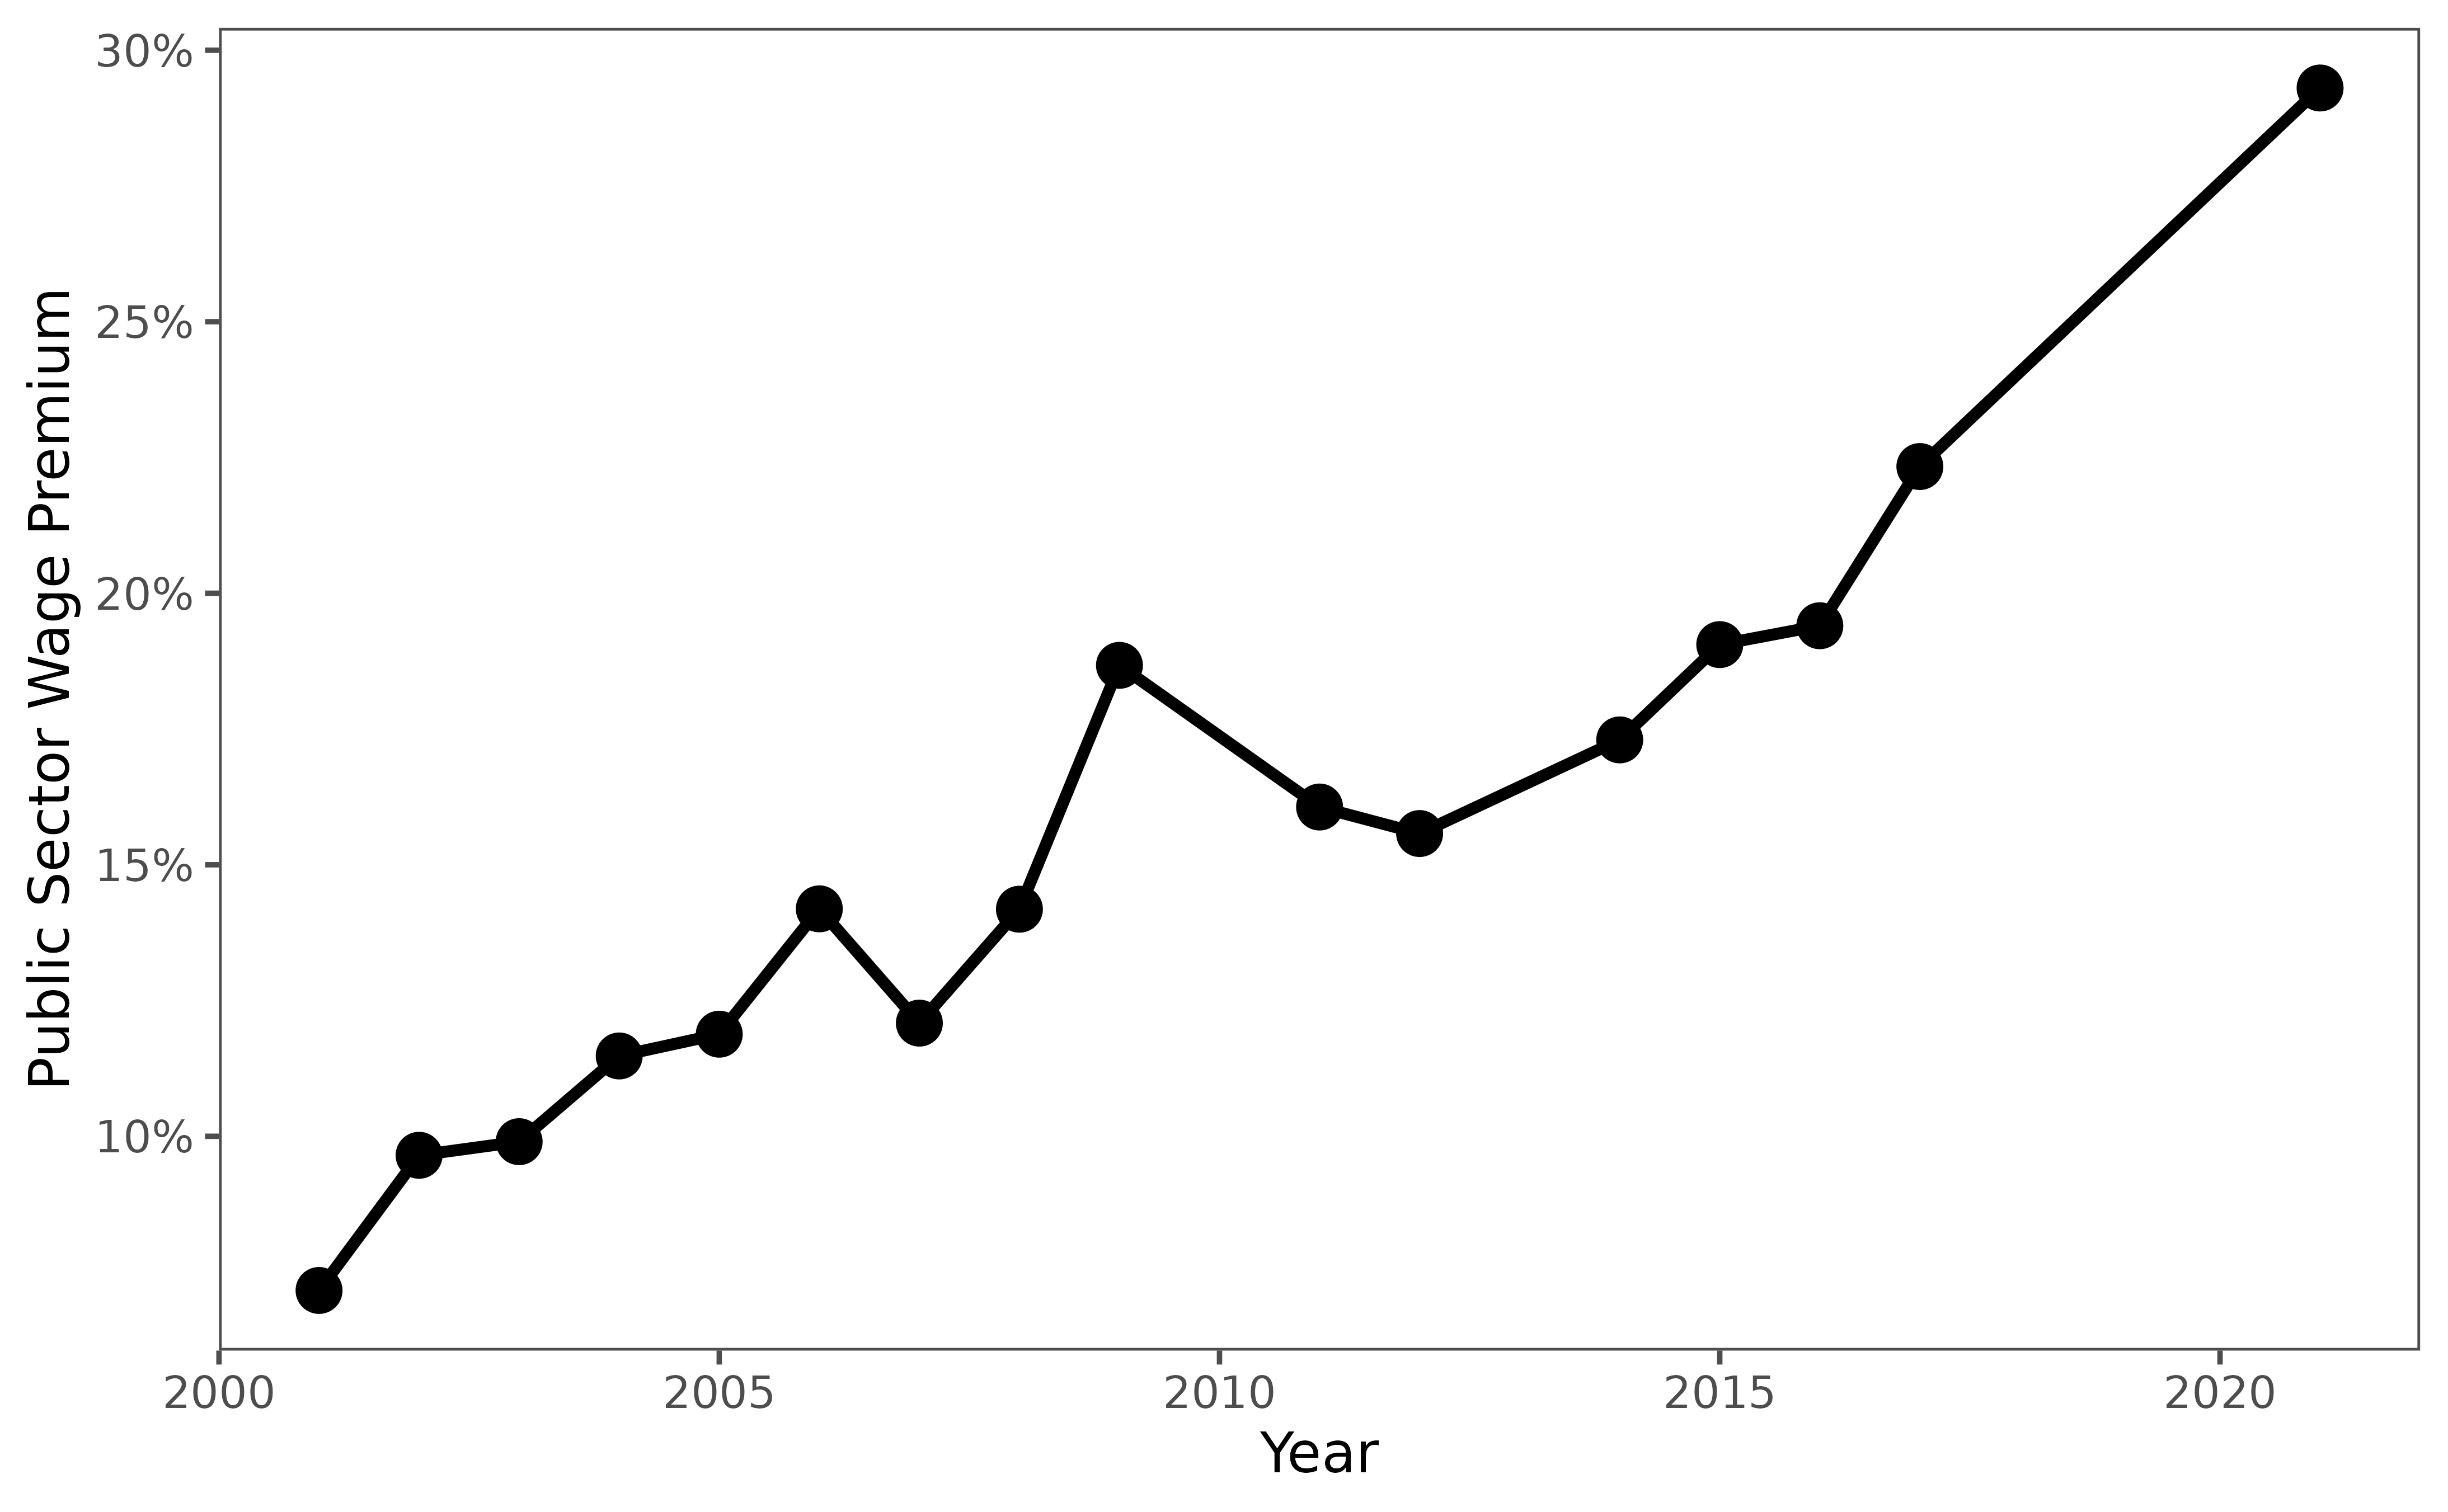
3.4.1. Public sector wage premium
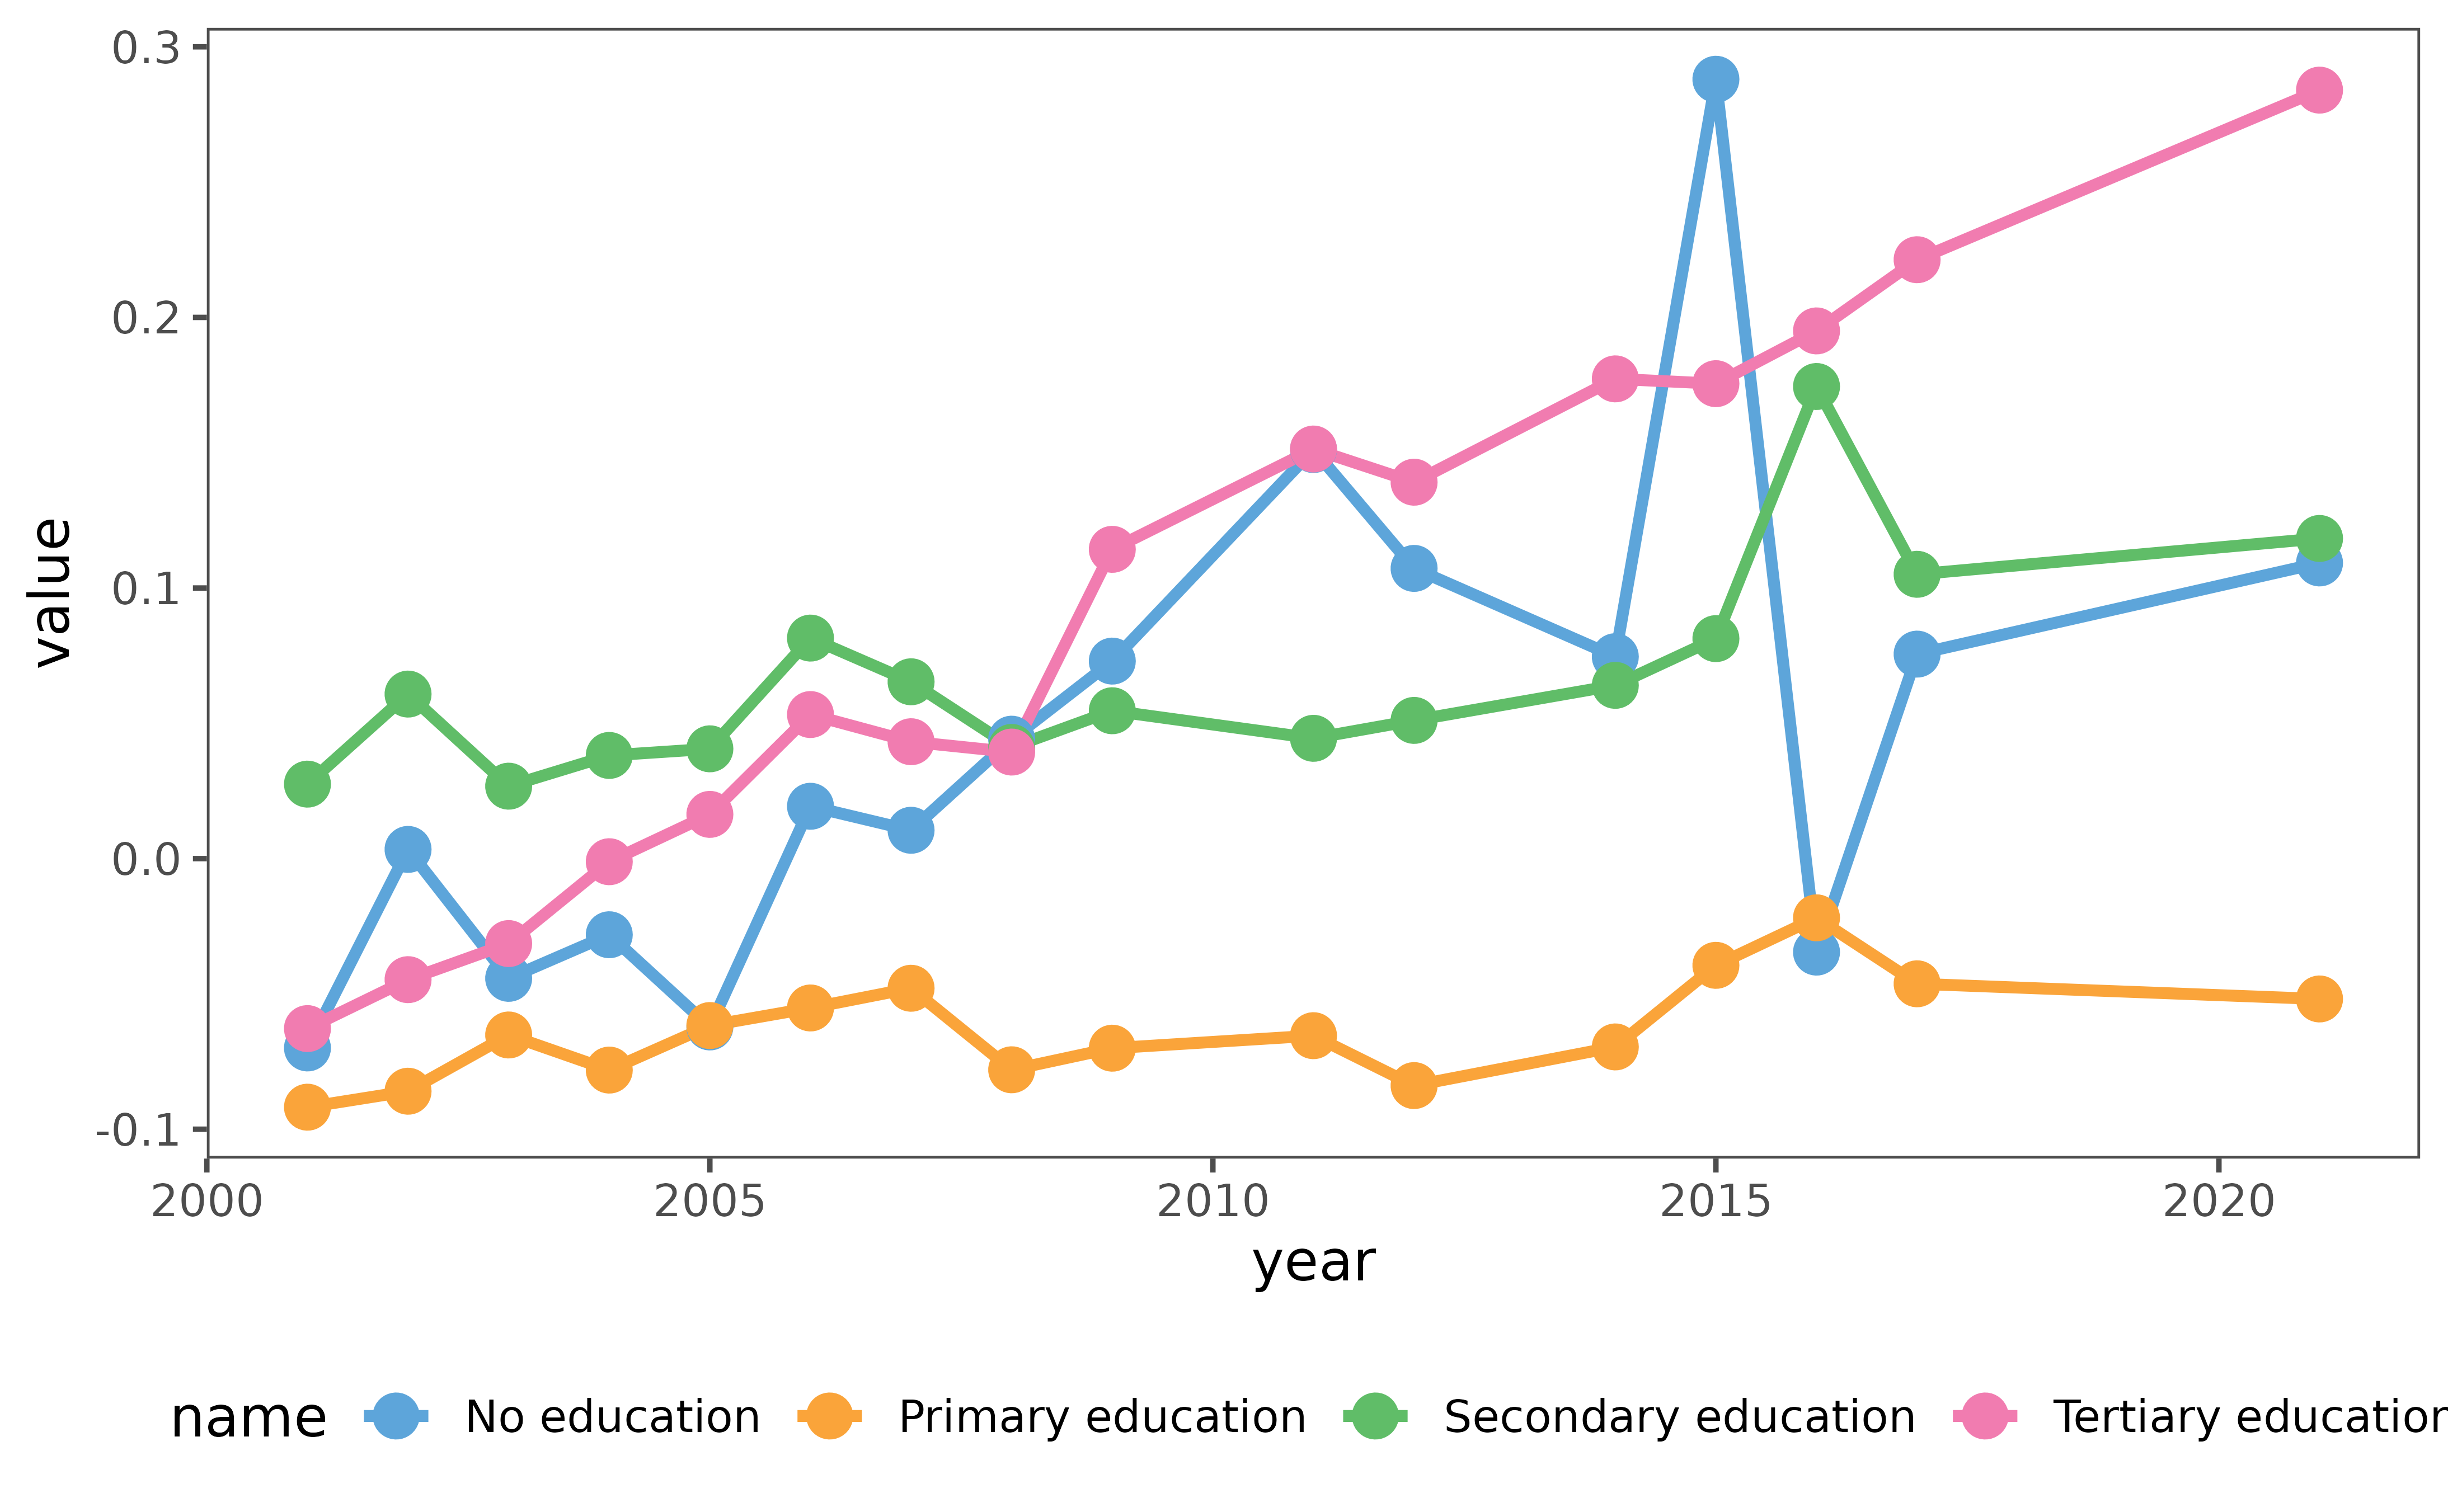
3.4.2. Public sector wage premium by education level
3.4.3. Pay comparisons for occupations across public sectors
## [1] "Not available: no cross-country occupation wage data available"Wage equity – whether workers in similar jobs, with similar skills, similar years of service, and similar performance are paid equally, and differences in salary between different occupations are deemed legitimate – is important for both employee motivation and public sector productivity. This section provides some key stylized facts that provide evidence of wage equity in the public sector.
Guidance questions for the assessment:
- Is there “equal pay for equal work”? Do workers in similar jobs with similar skills get similar wages? Answering this question requires an assessment of the public sector salary structure.
- Is there gender equality in pay in aggregate and across major occupations? Does government have a policy to address gender inequity?
- What are the sources of wage inequity? Are pay relativities in salary scales derived from robust job evaluations? Are there discretionary elements of pay, such as cash payments or allowances?
- Is there a justifiable tradeoff between wage inequity and wage competitiveness in order to attract high-demand talent while maintaining general coherence of pay across the public sector?
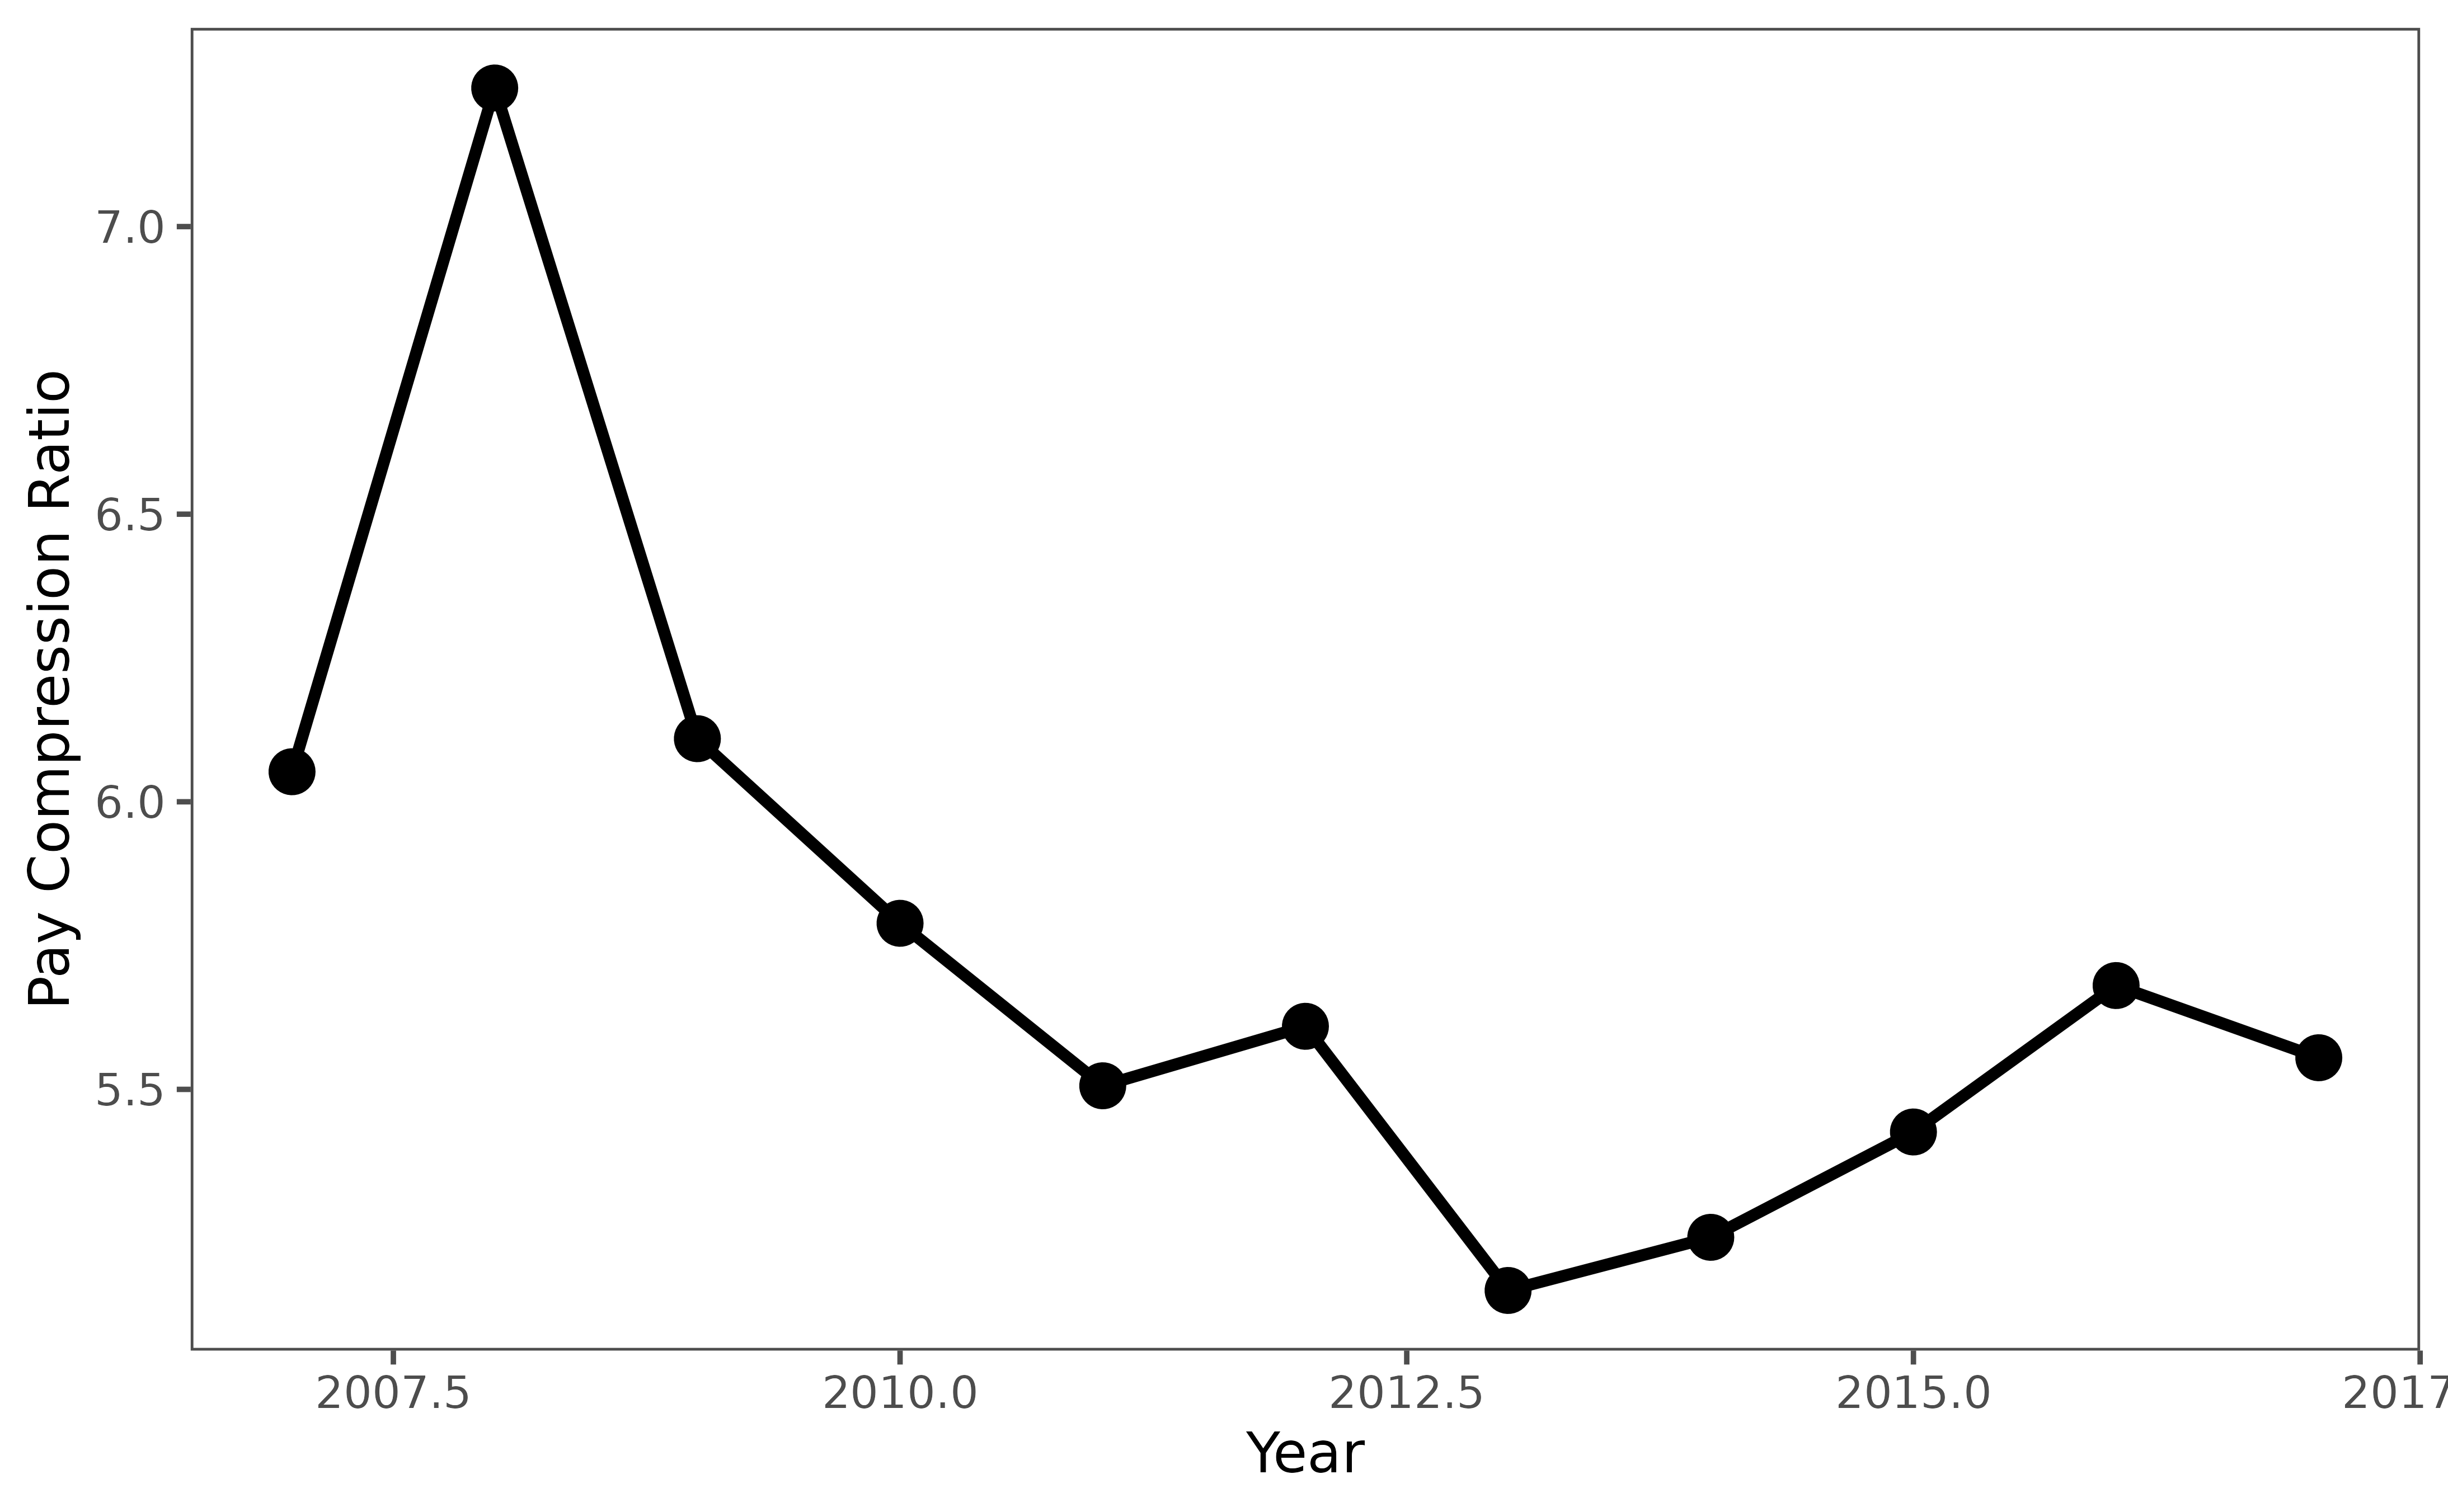
3.5.1. Pay compression ratio in the public sector
3.5.2. Pay dispersion in the public sector
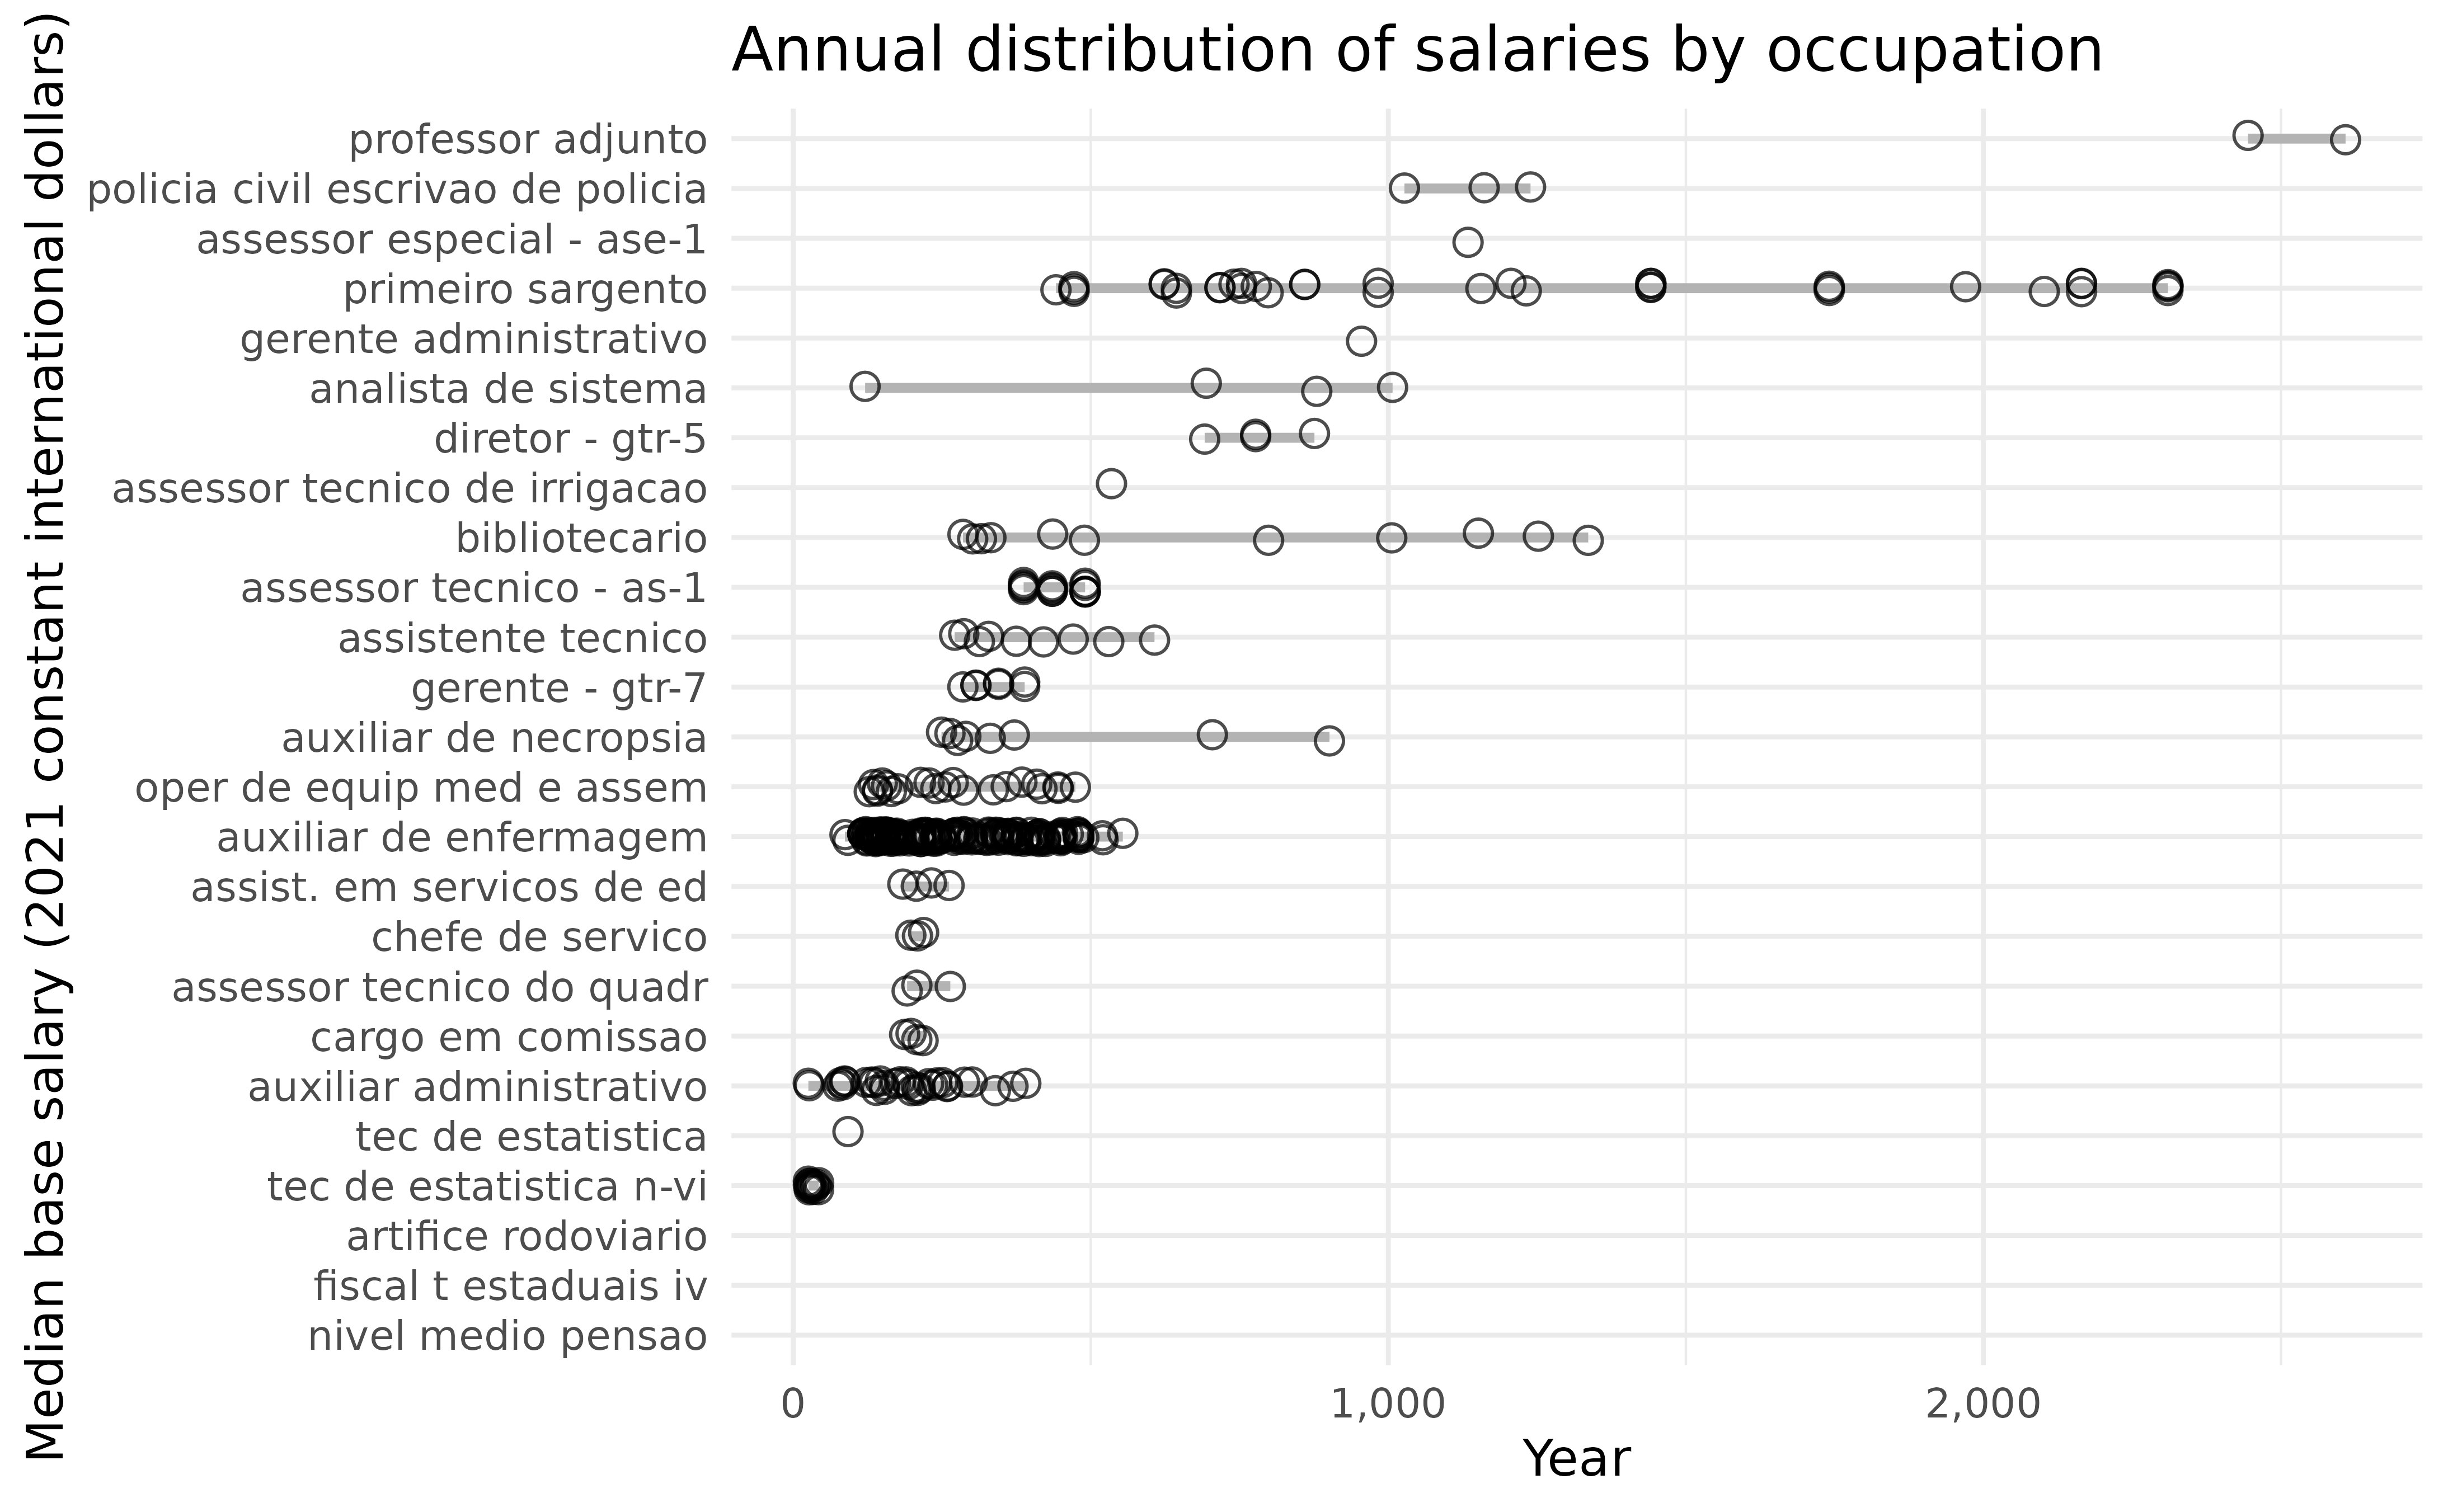
3.5.3. Within-occupation public sector pay dispersion
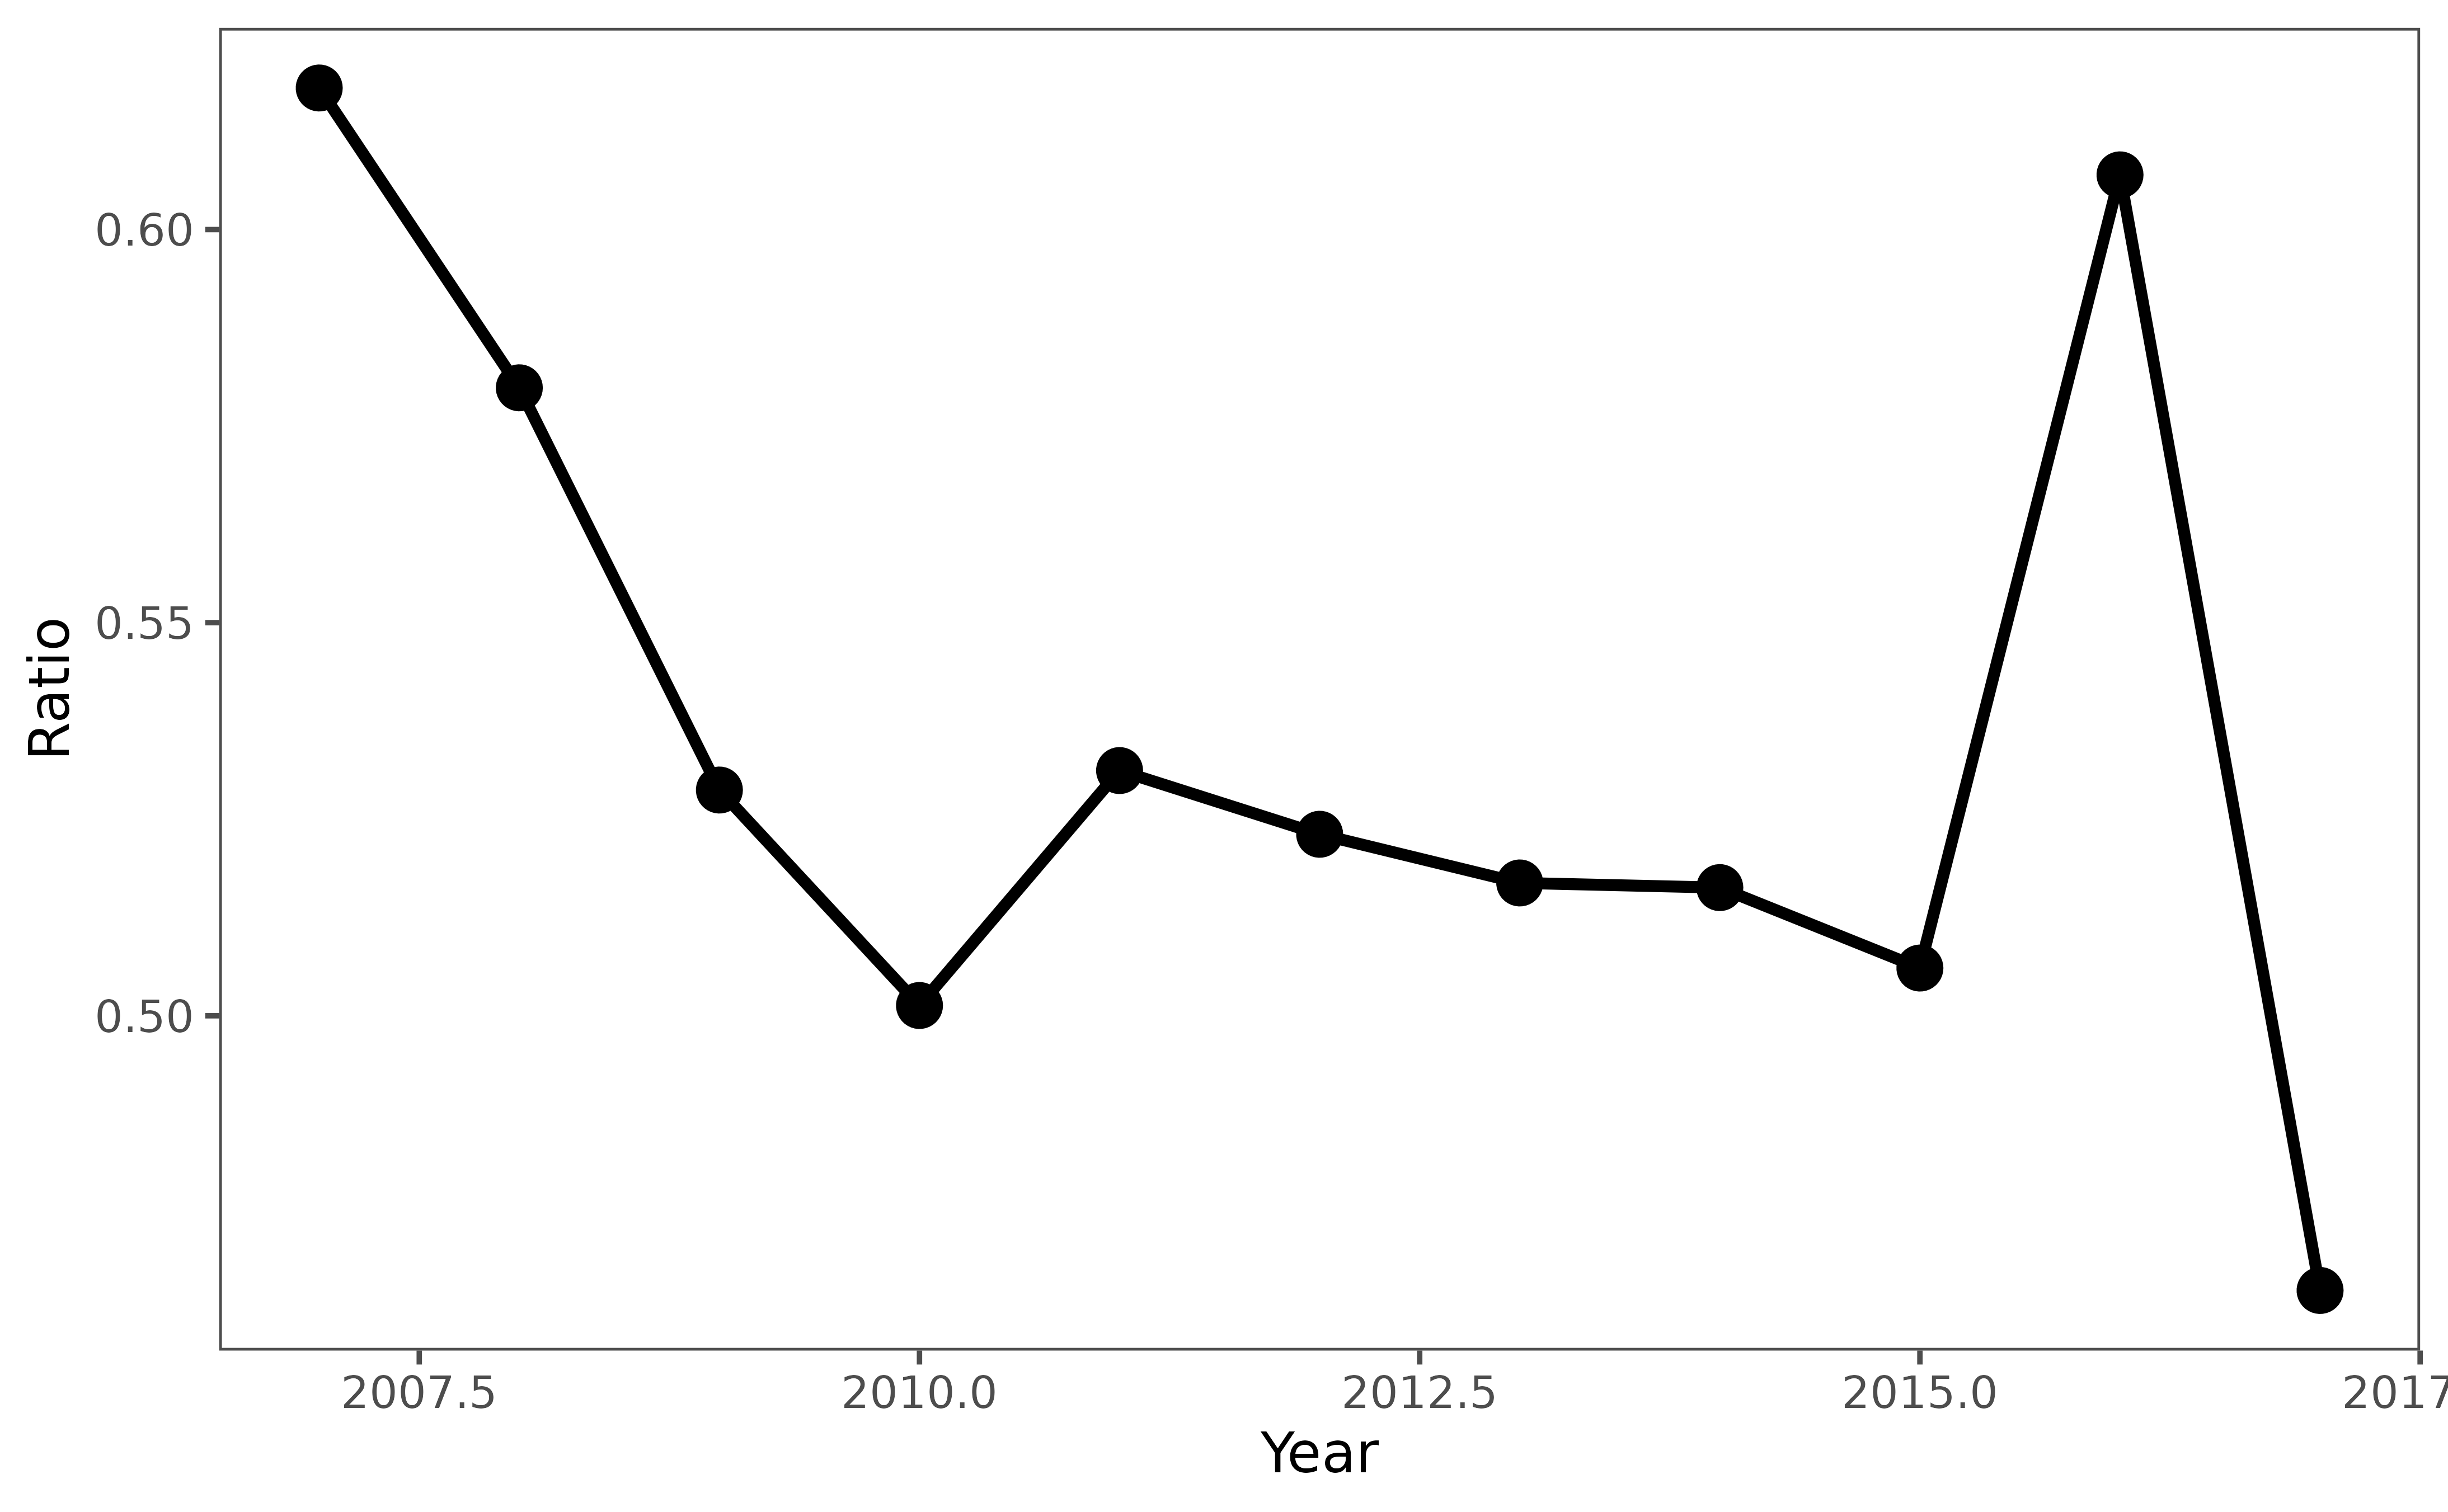
3.5.4. Female-male wage ratio
3.5.5. Gender wage premium
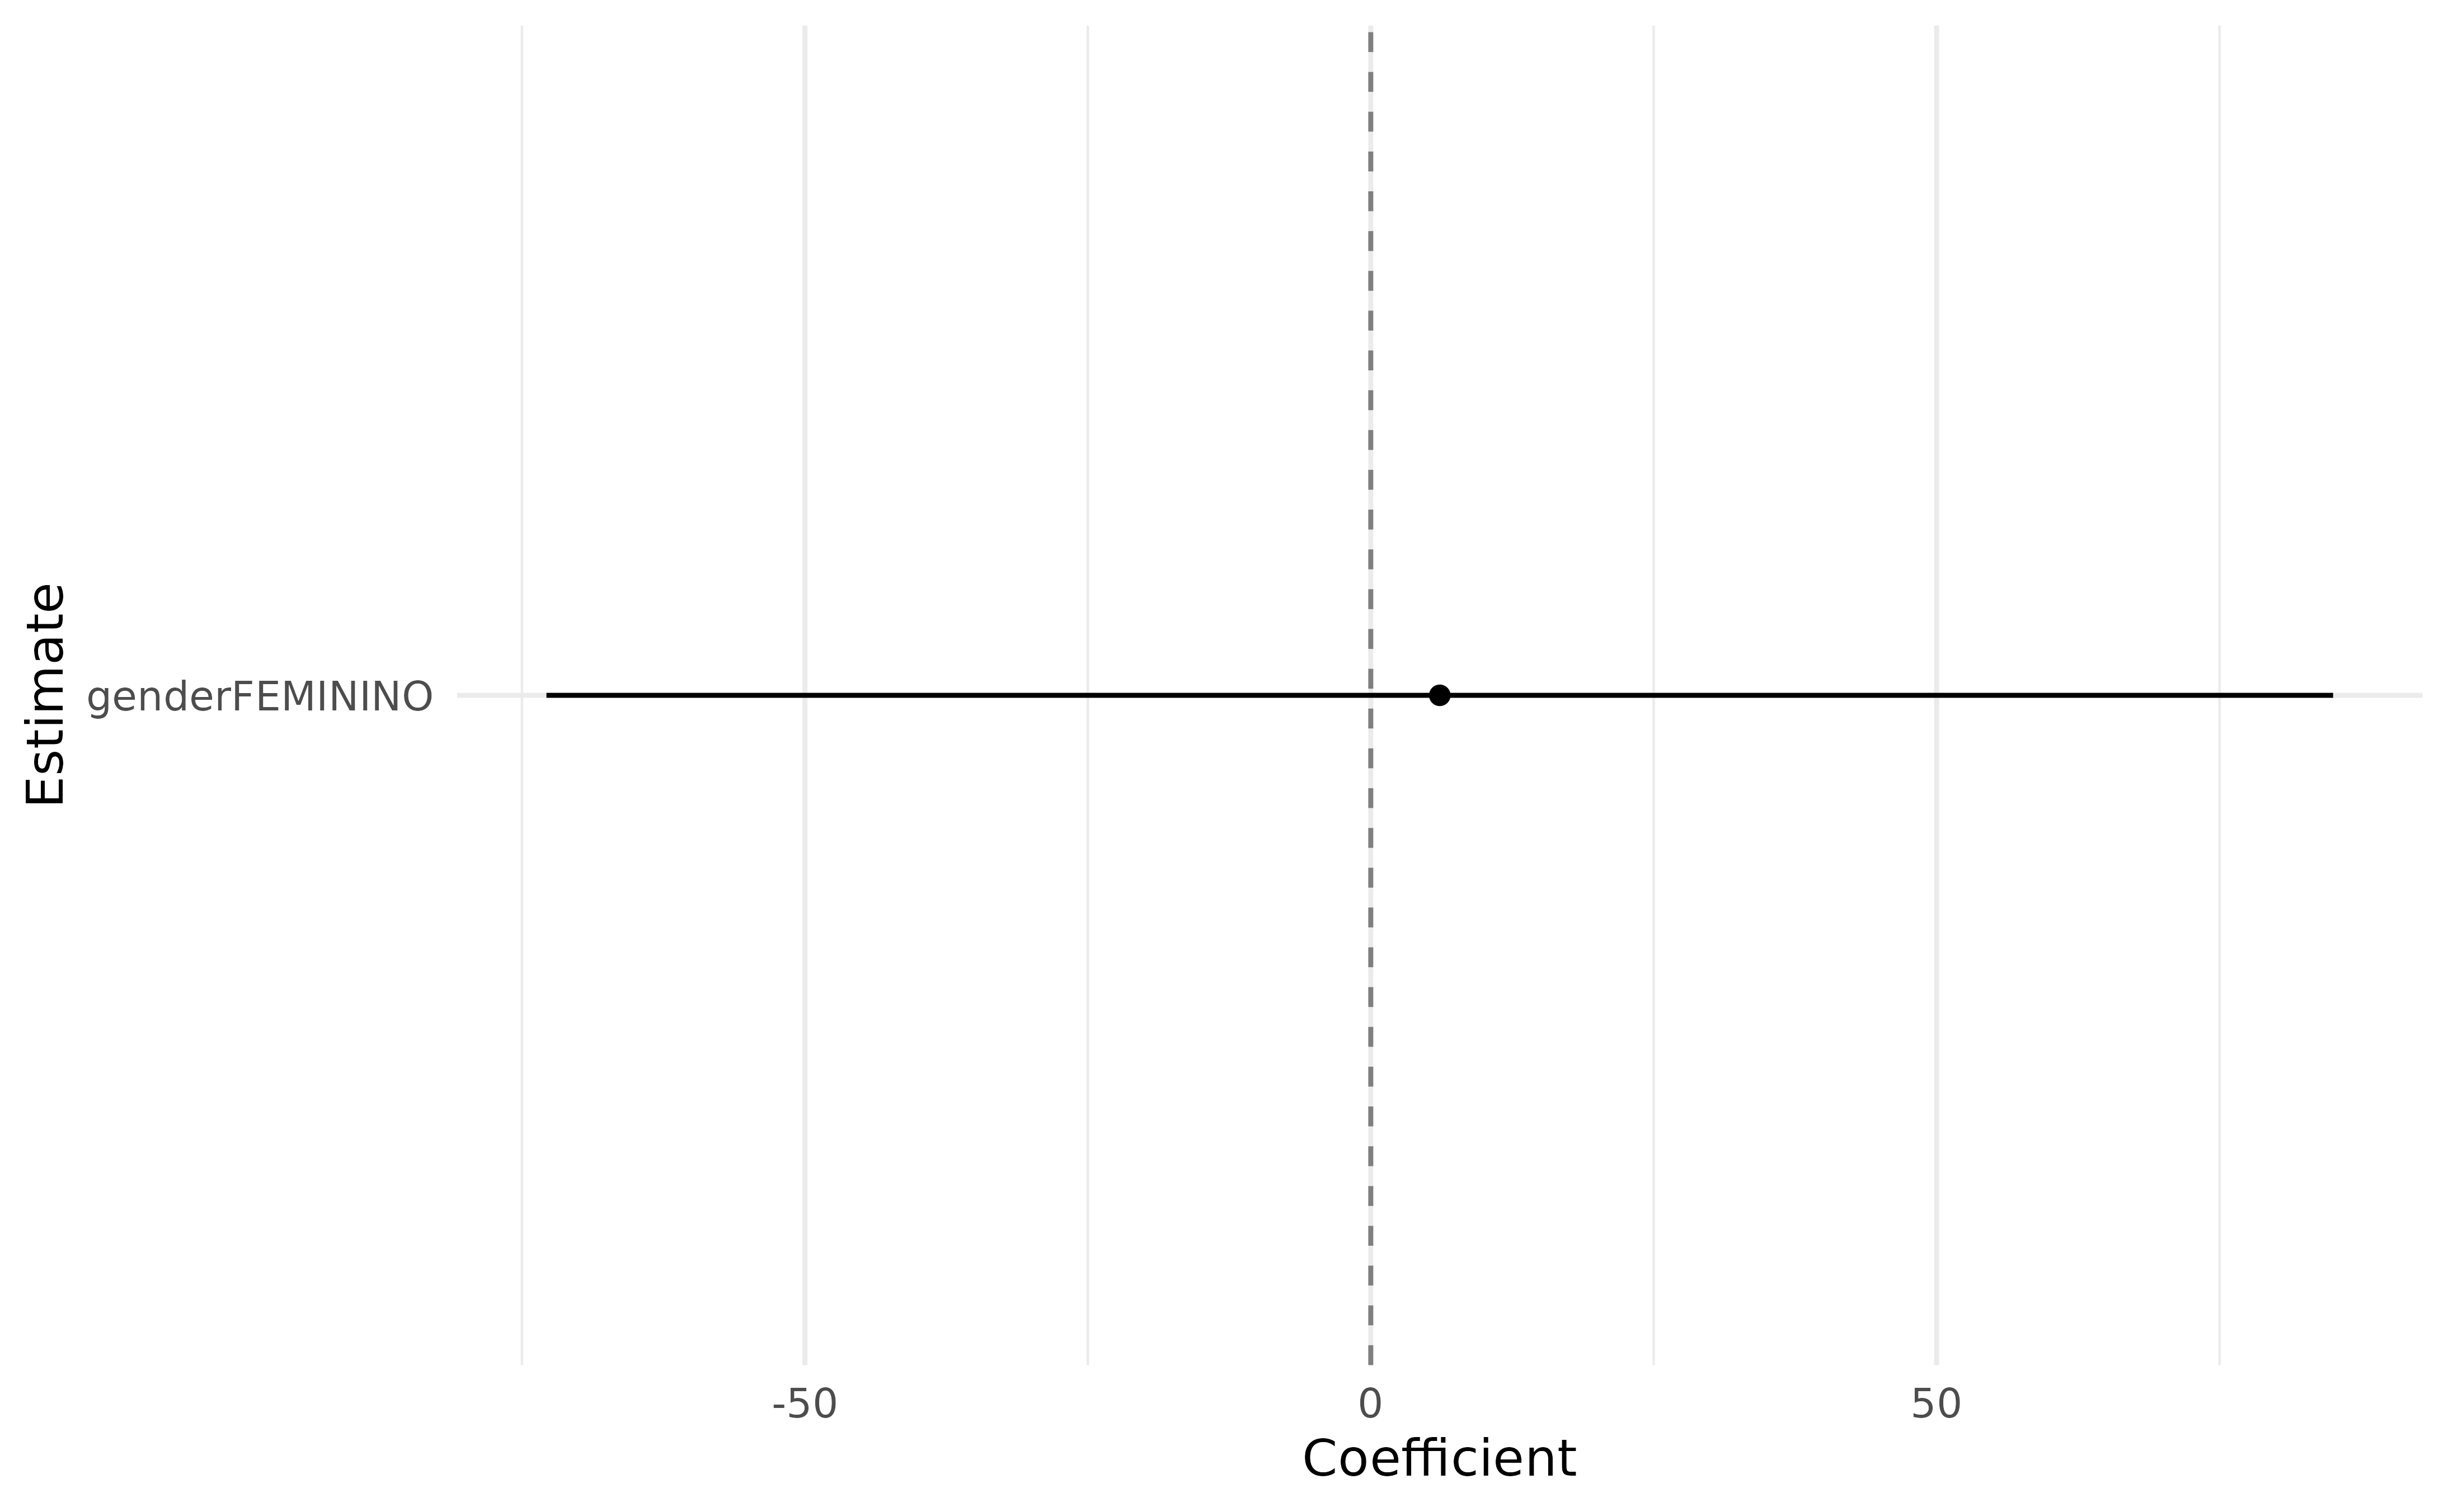
Overview
The extent to which wage increases are explicitly linked to performance is important for both employee motivation and public sector productivity. This section provide some key stylized facts that provide evidence of the productivity and fiscal implications of pay incentives. These include: the magnitude of promotion-based and seniority-based annual wage increases, expected wage increases over an employee’s career and the coverage and key design features of performance bonuses.
Guidance questions for the assessment:
- What wage growth is typical for public sector employees in different occupational groups over the course of their career? How of much of this wage growth is dependent on promotions and how much can occur “within grade”?
- Does the annual performance management system distinguish between high and low performers? Are promotion decisions largely seniority based and/or automatic?
- Are there performance bonus schemes and if so what occupation groups and percentage of the staff receive them; and how large is the bonus that staff are expected to receive?
- Is there targeted, significant additional pay for essential personnels to serve in hard-to-staff locations such as rural areas?
3.6.1. Percentage of staff receiving highest performance ratings
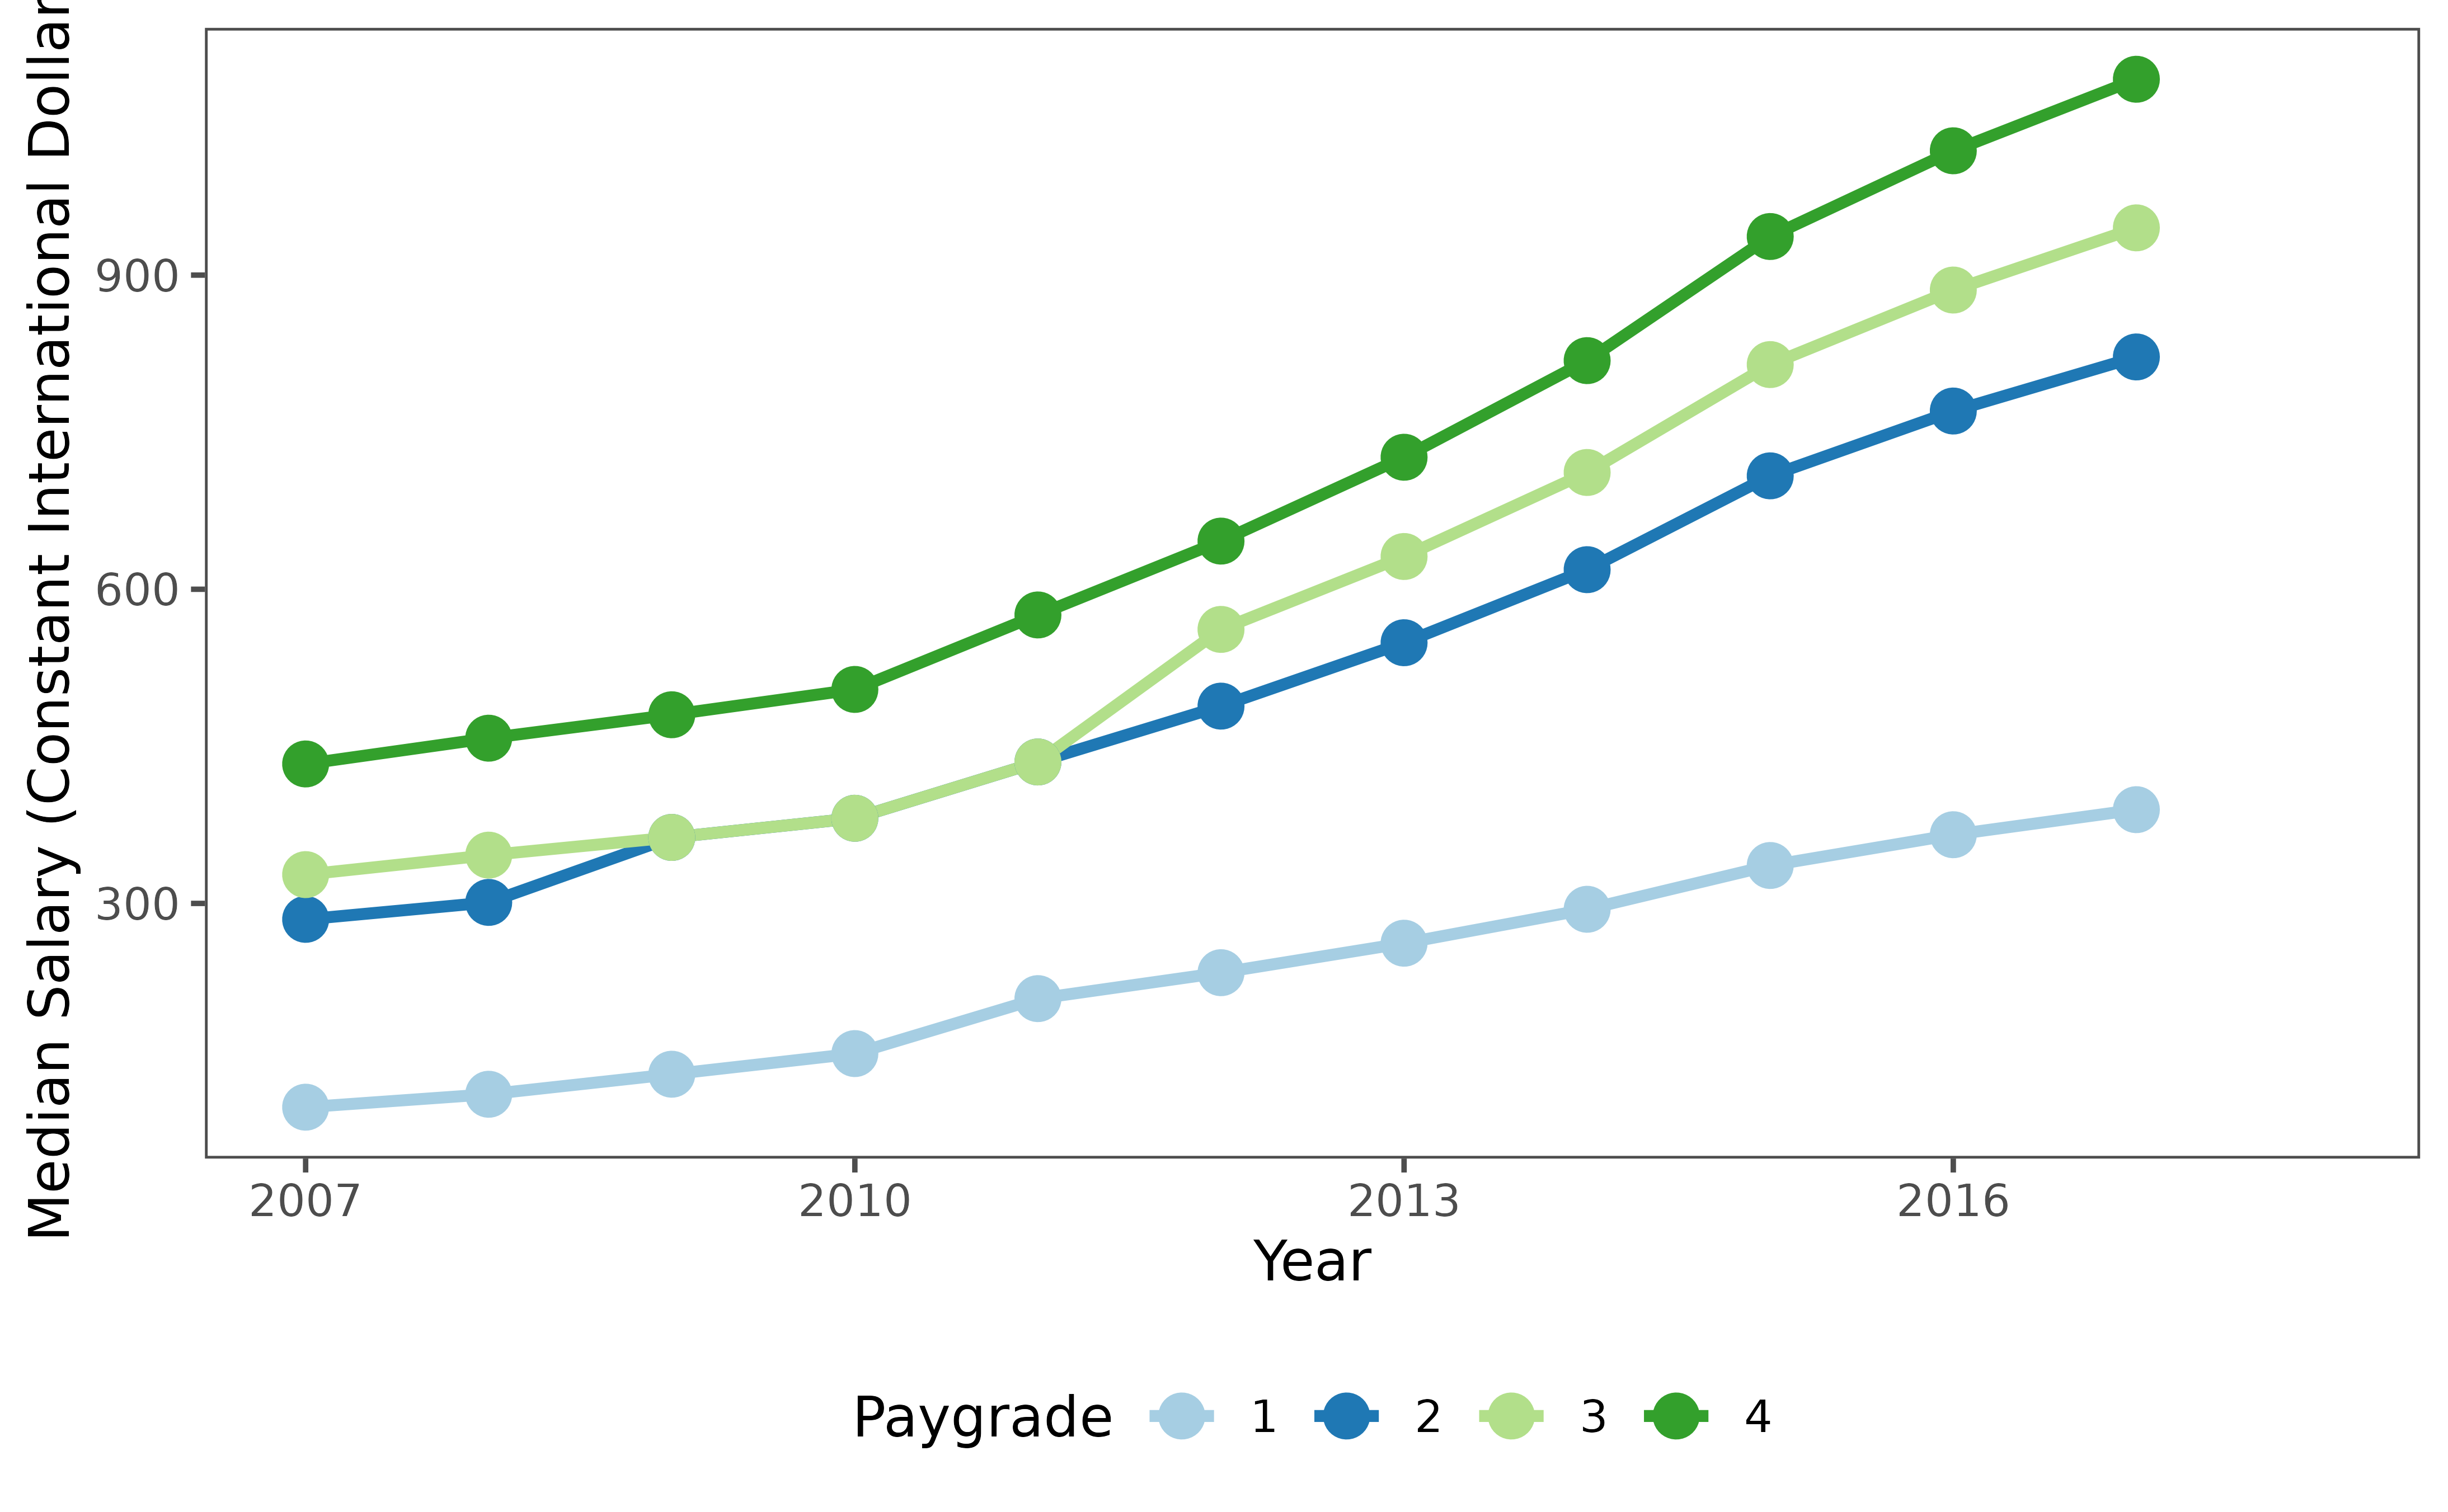
## [1] "Not available: no performance rating data available"3.6.2. The size of annual, within-grade pay increases
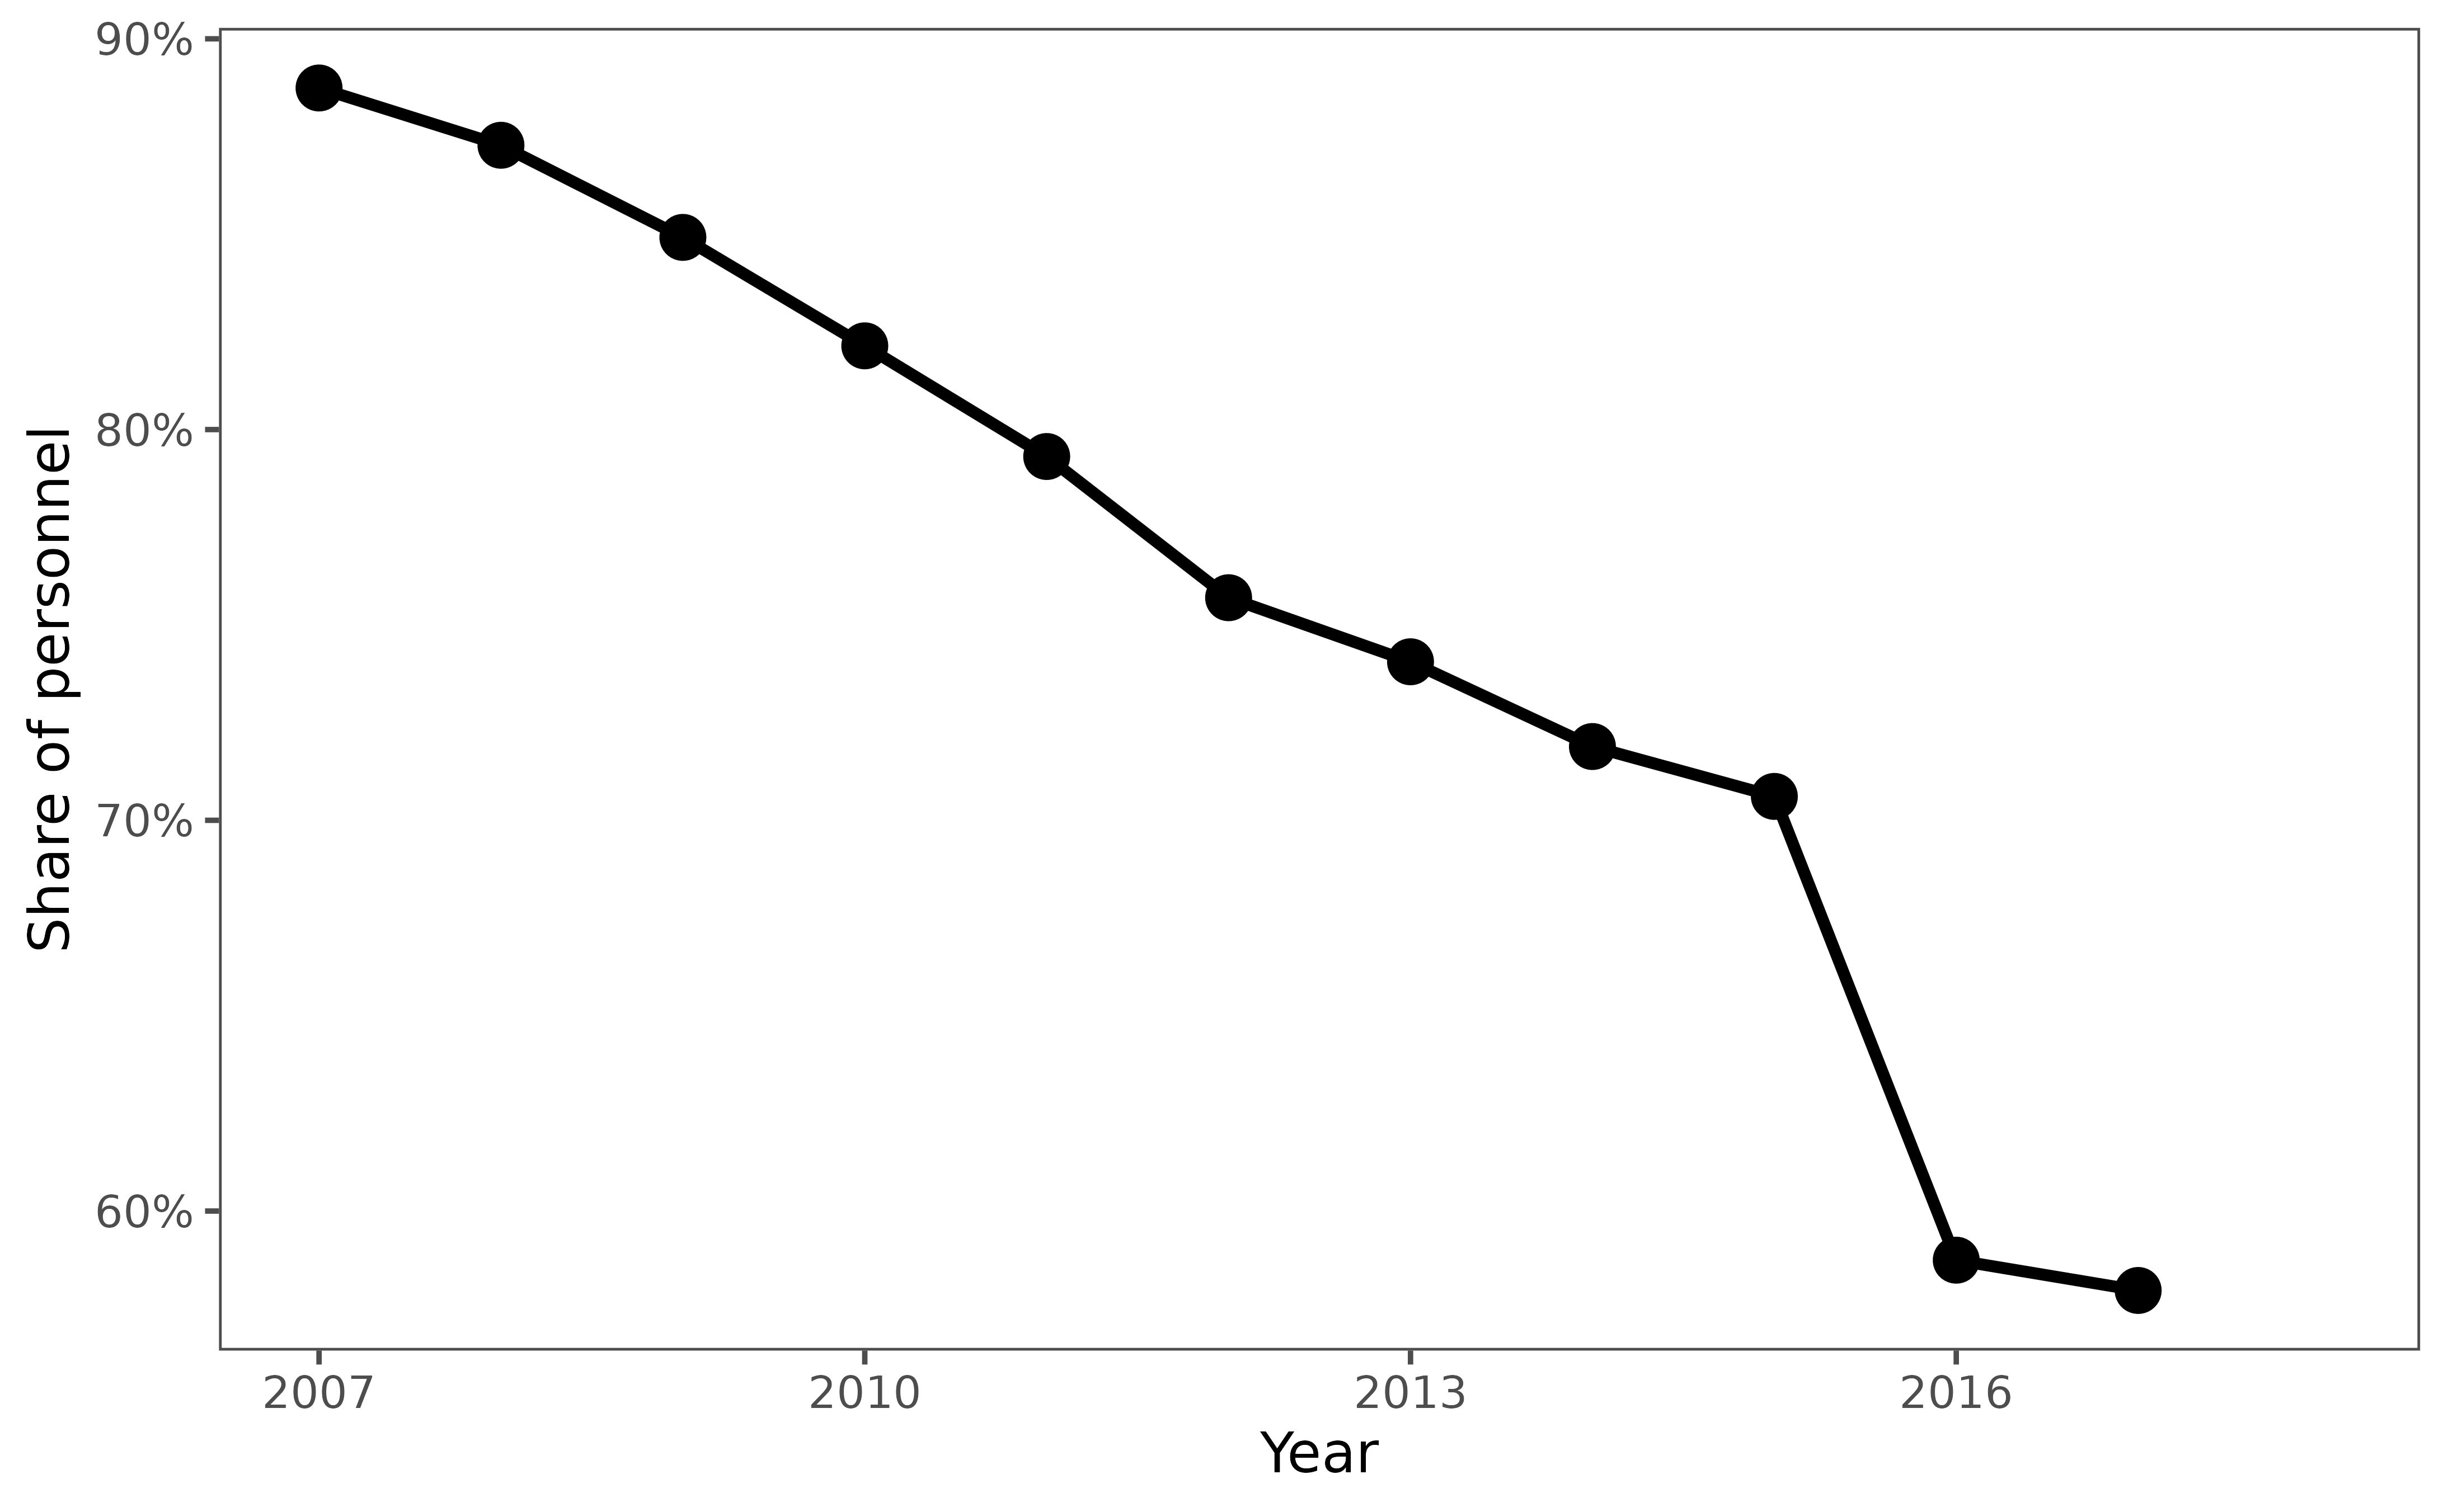
3.6.3. percentage of staff receiving a performance bonus
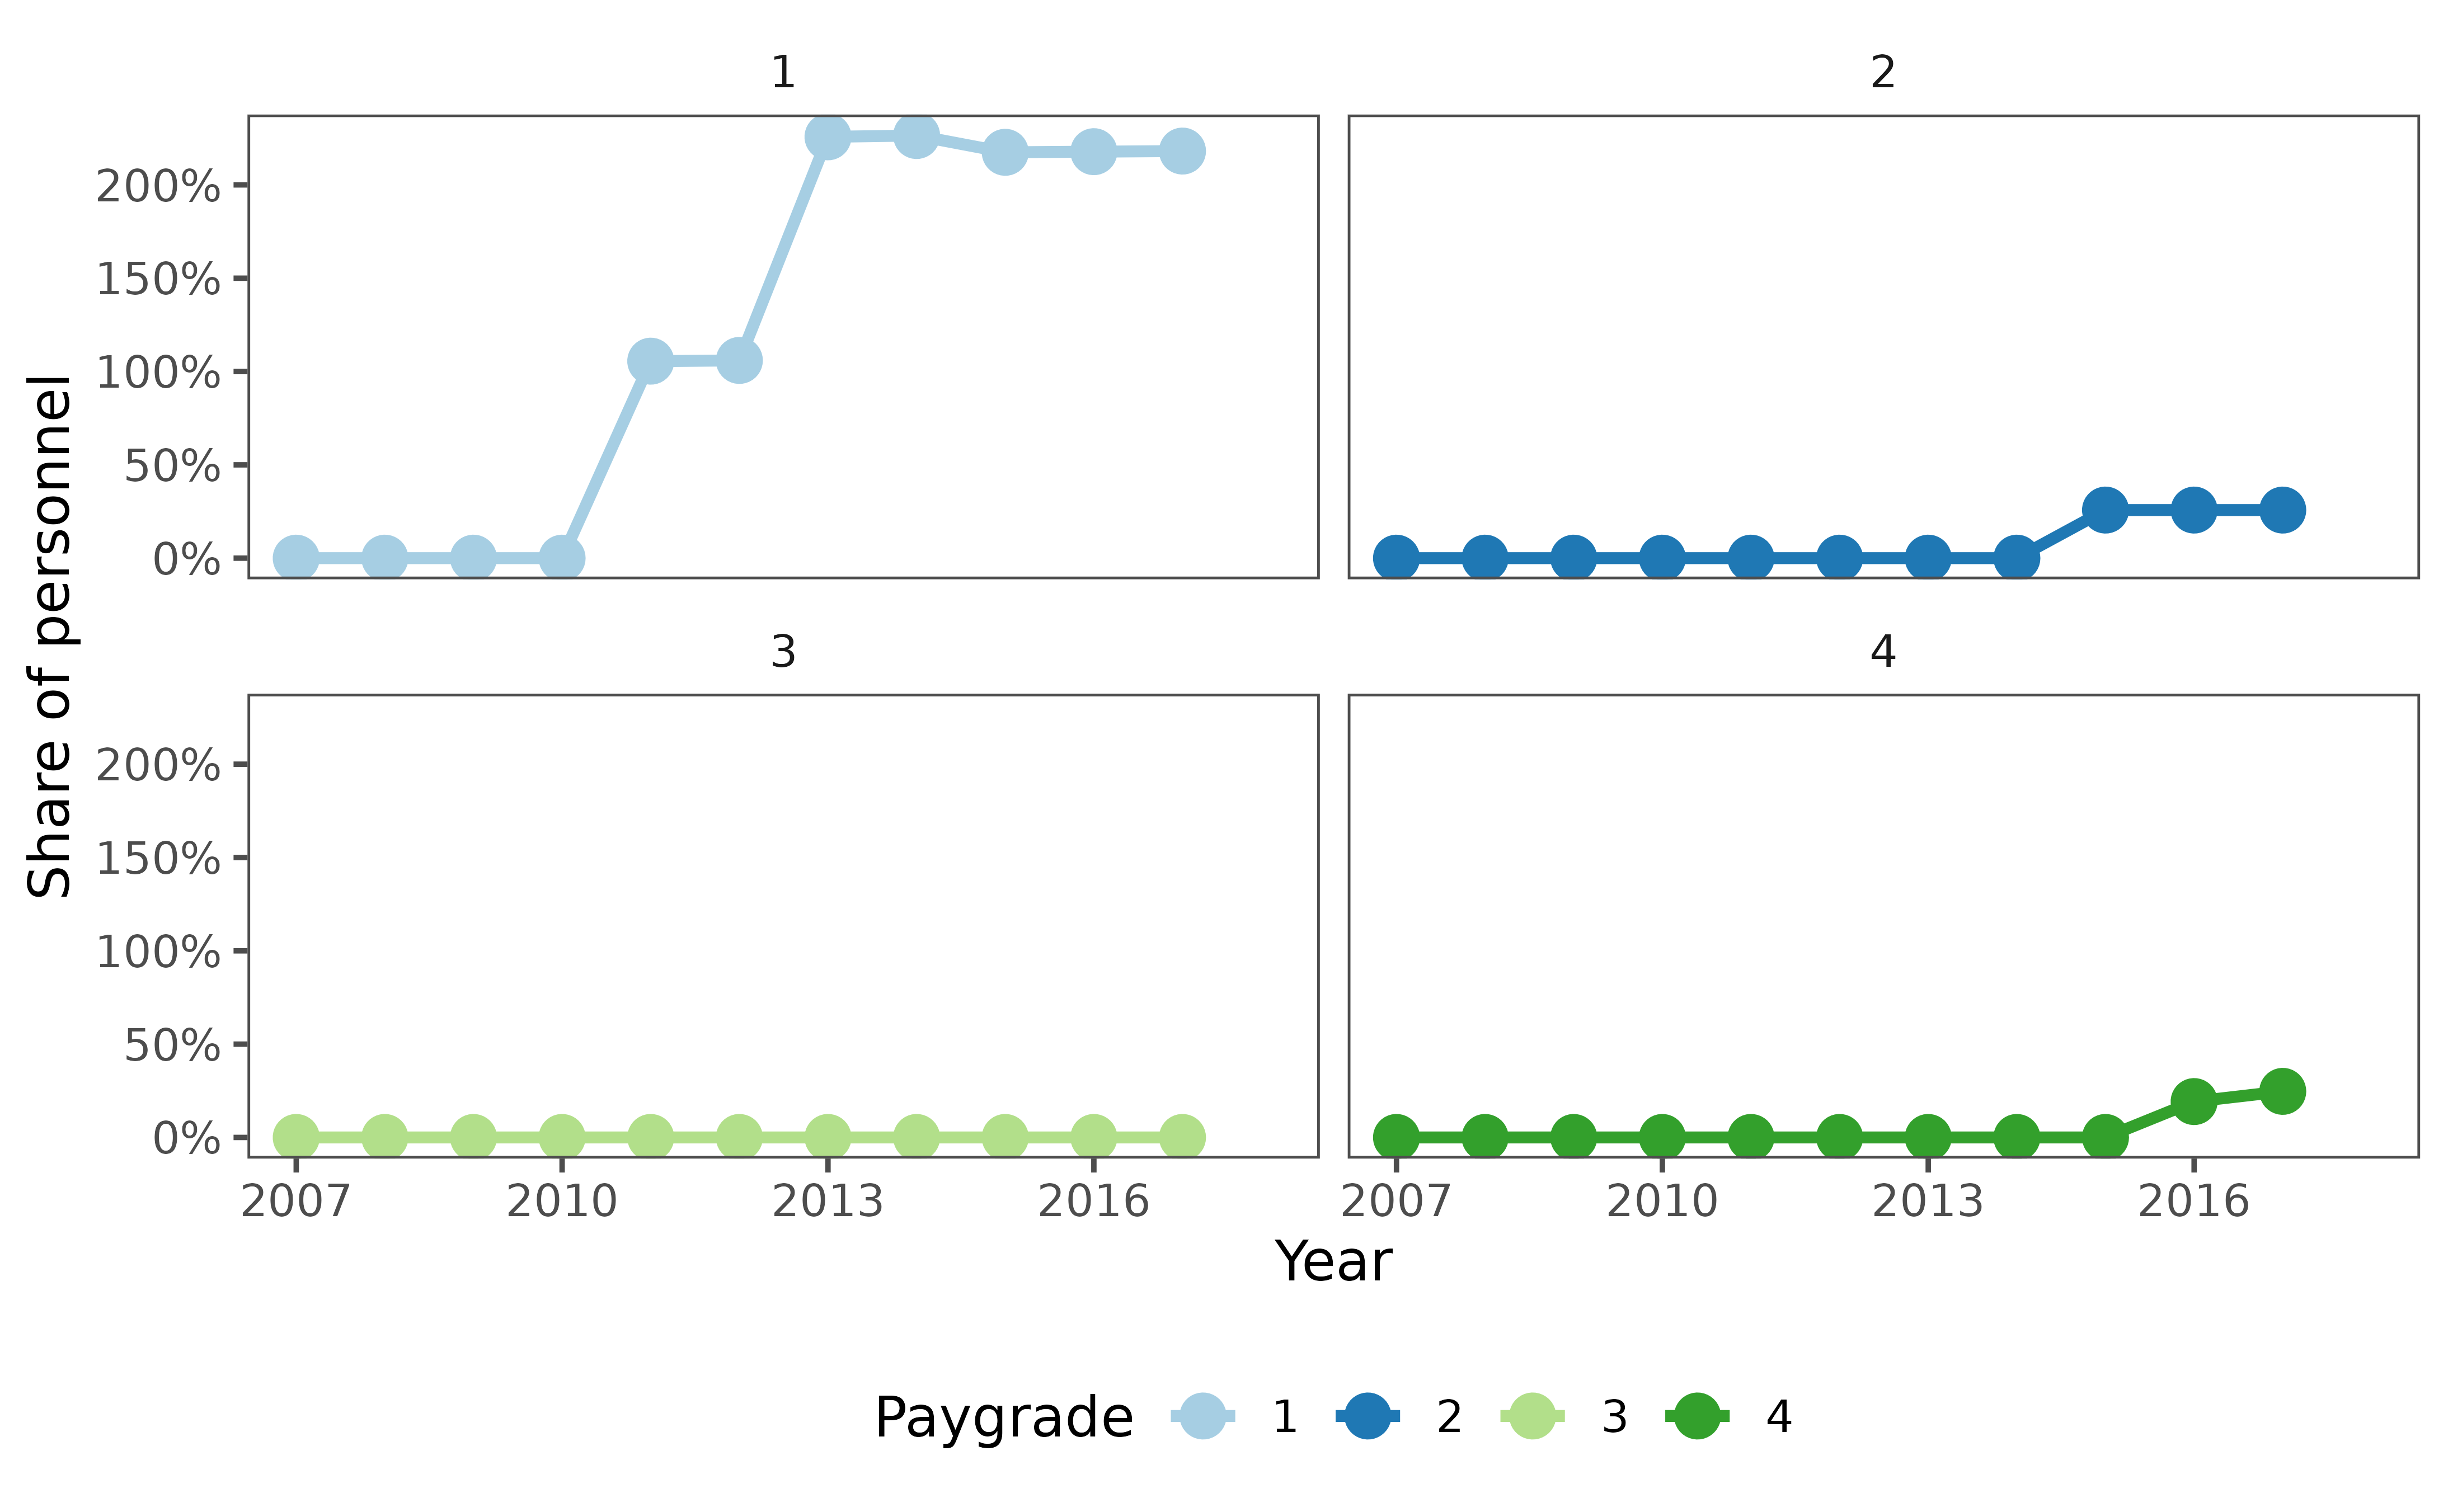
3.6.4. Performance bonus as a percentage of basic pay
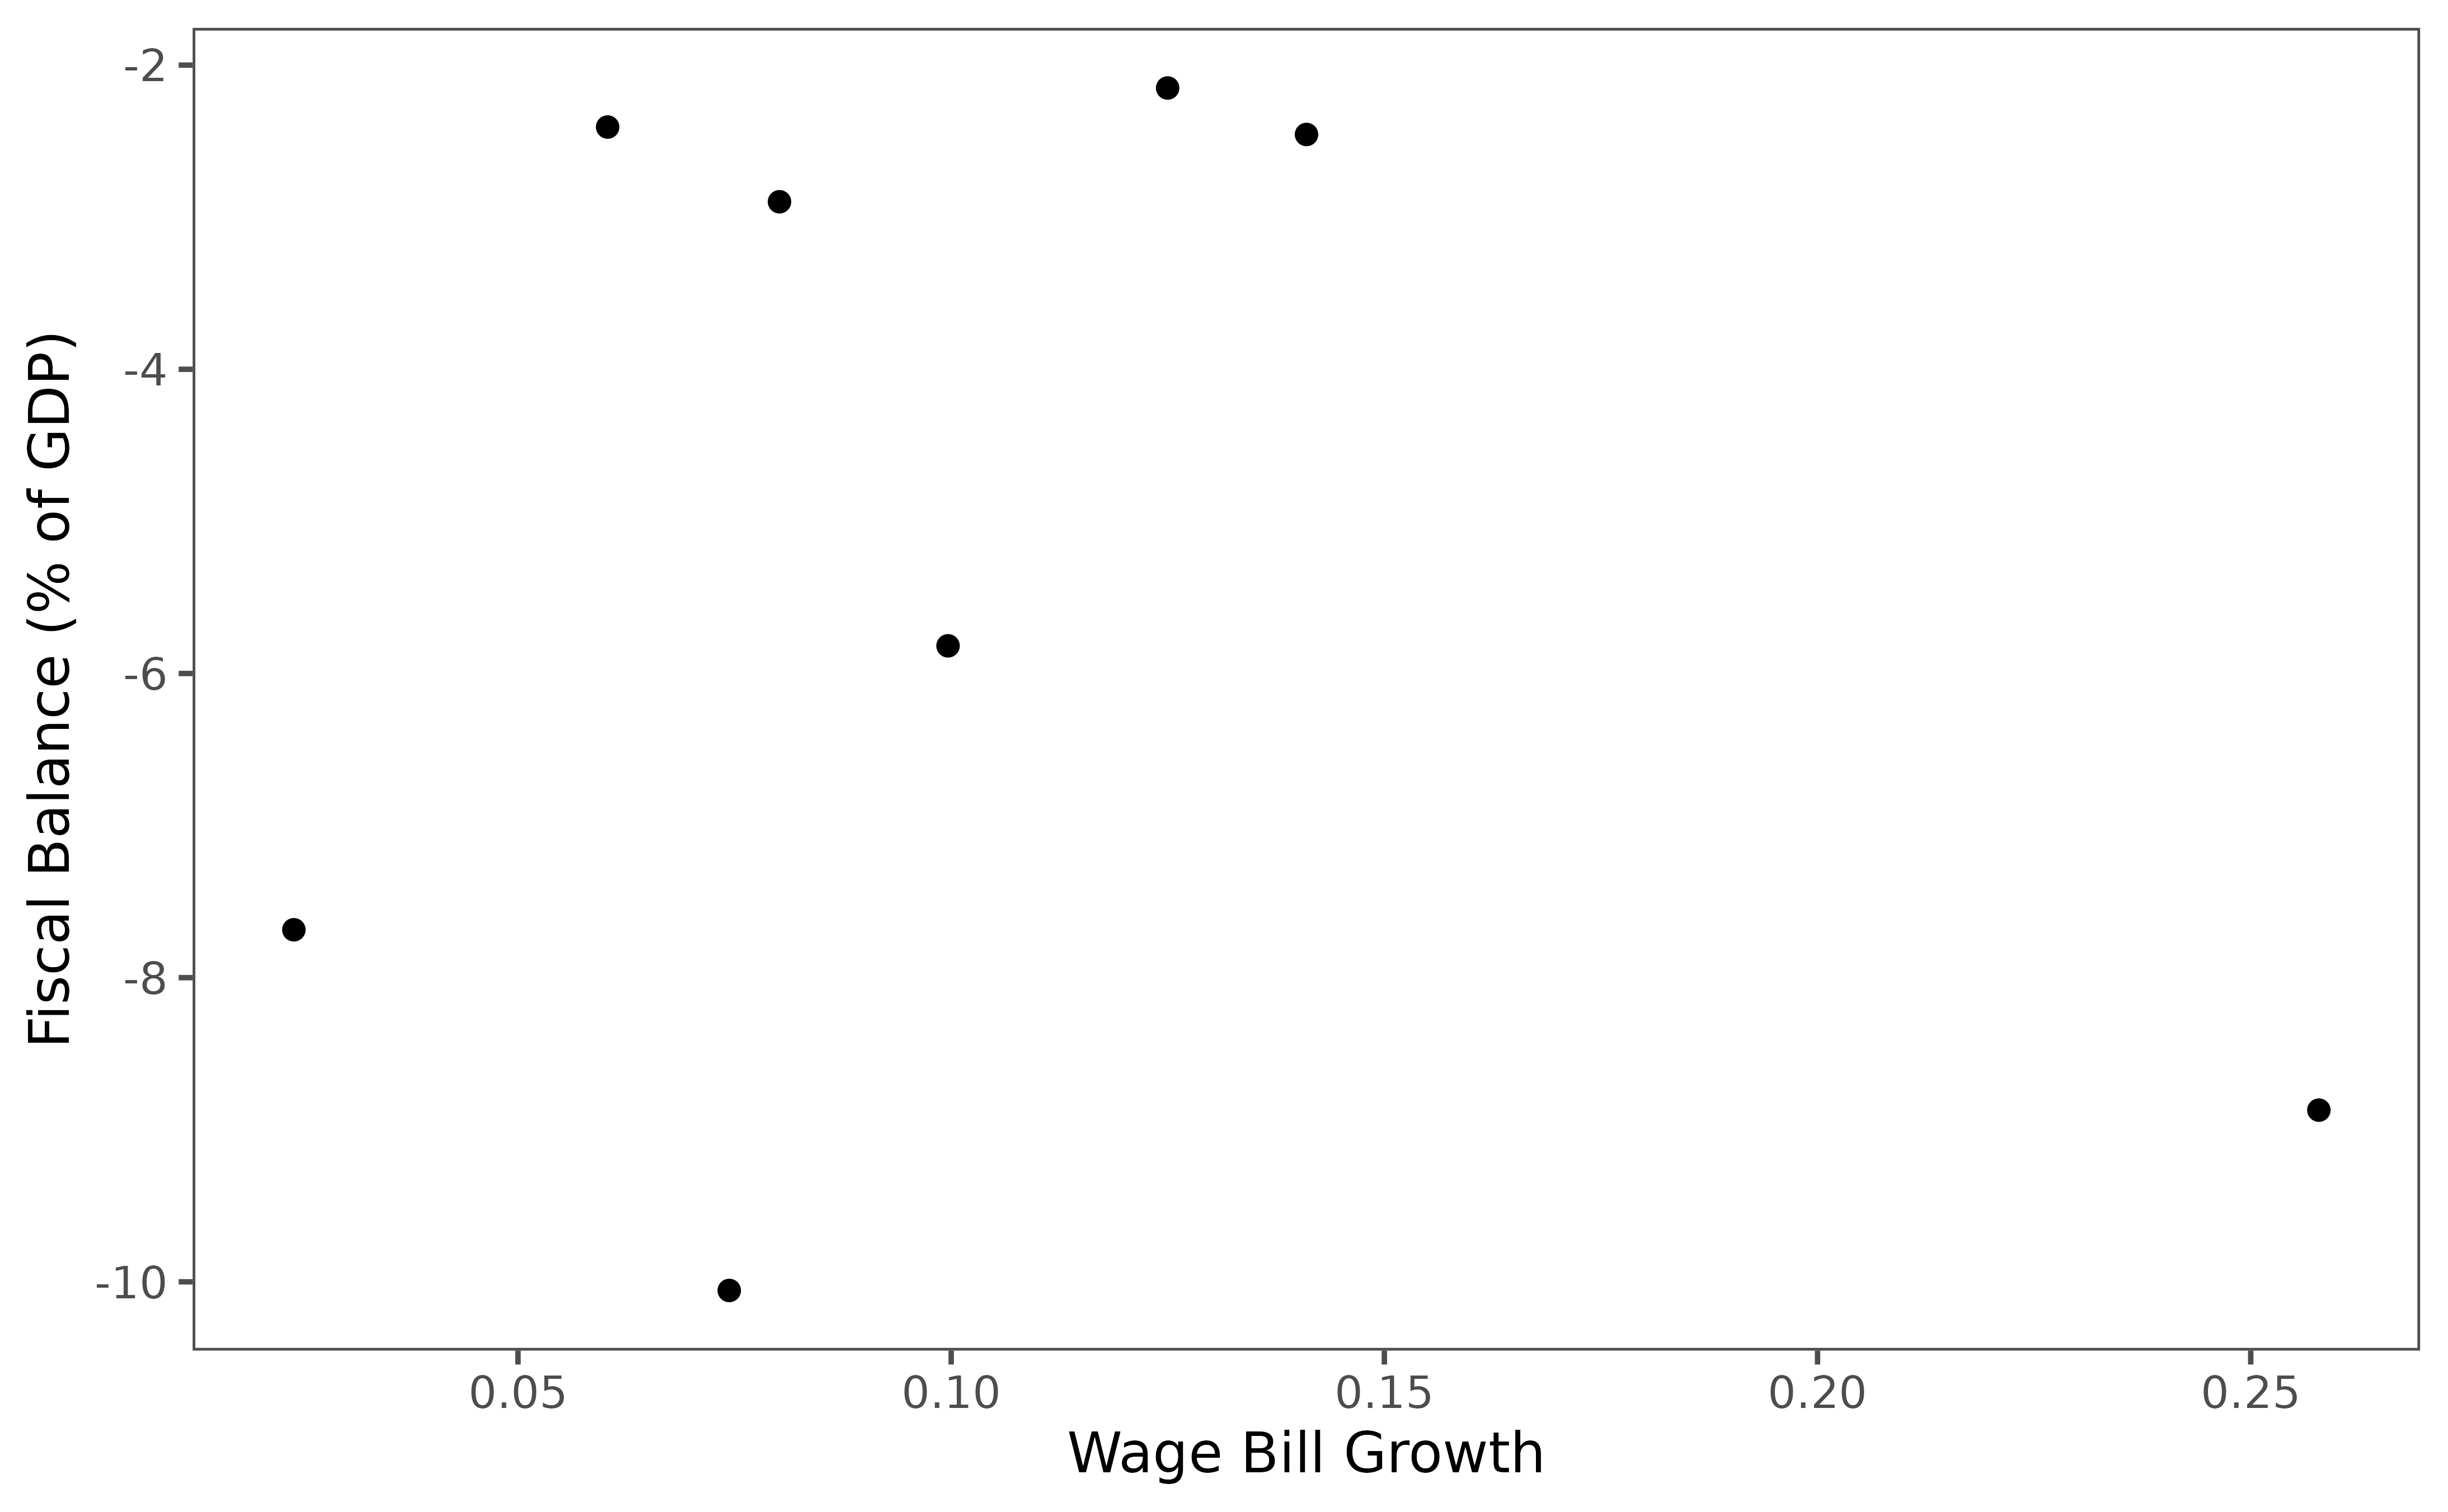
The wage bill can potentially have a major effect on fiscal balances, but there are no simple benchmarks for the “right” size of the wage bill. In fact, cross-national evidence suggests that there is no strong correlation between the size of the wage bill and fiscal balance. Wage bill dynamics are a better predictor of fiscal sustainability. In general, increases in the wage bill are associated with worsening of the fiscal balance. In addition, wage expenditures are pro-cyclical, rising during periods of economic growth, but not falling as much during downturns due to structural rigidity.
Guidance questions for the assessment:
- What are the wage bill dynamics and how are changes in the wage bill being financed - i.e. through deficits, raising revenues, or reducing other expenditures?
- What are the main drivers of wage bill growth?
- What are the wage bill projections for baseline and different policy option scenarios based on wage bill modeling?
4.1.1. Correlation between wage bill growth and fiscal balances
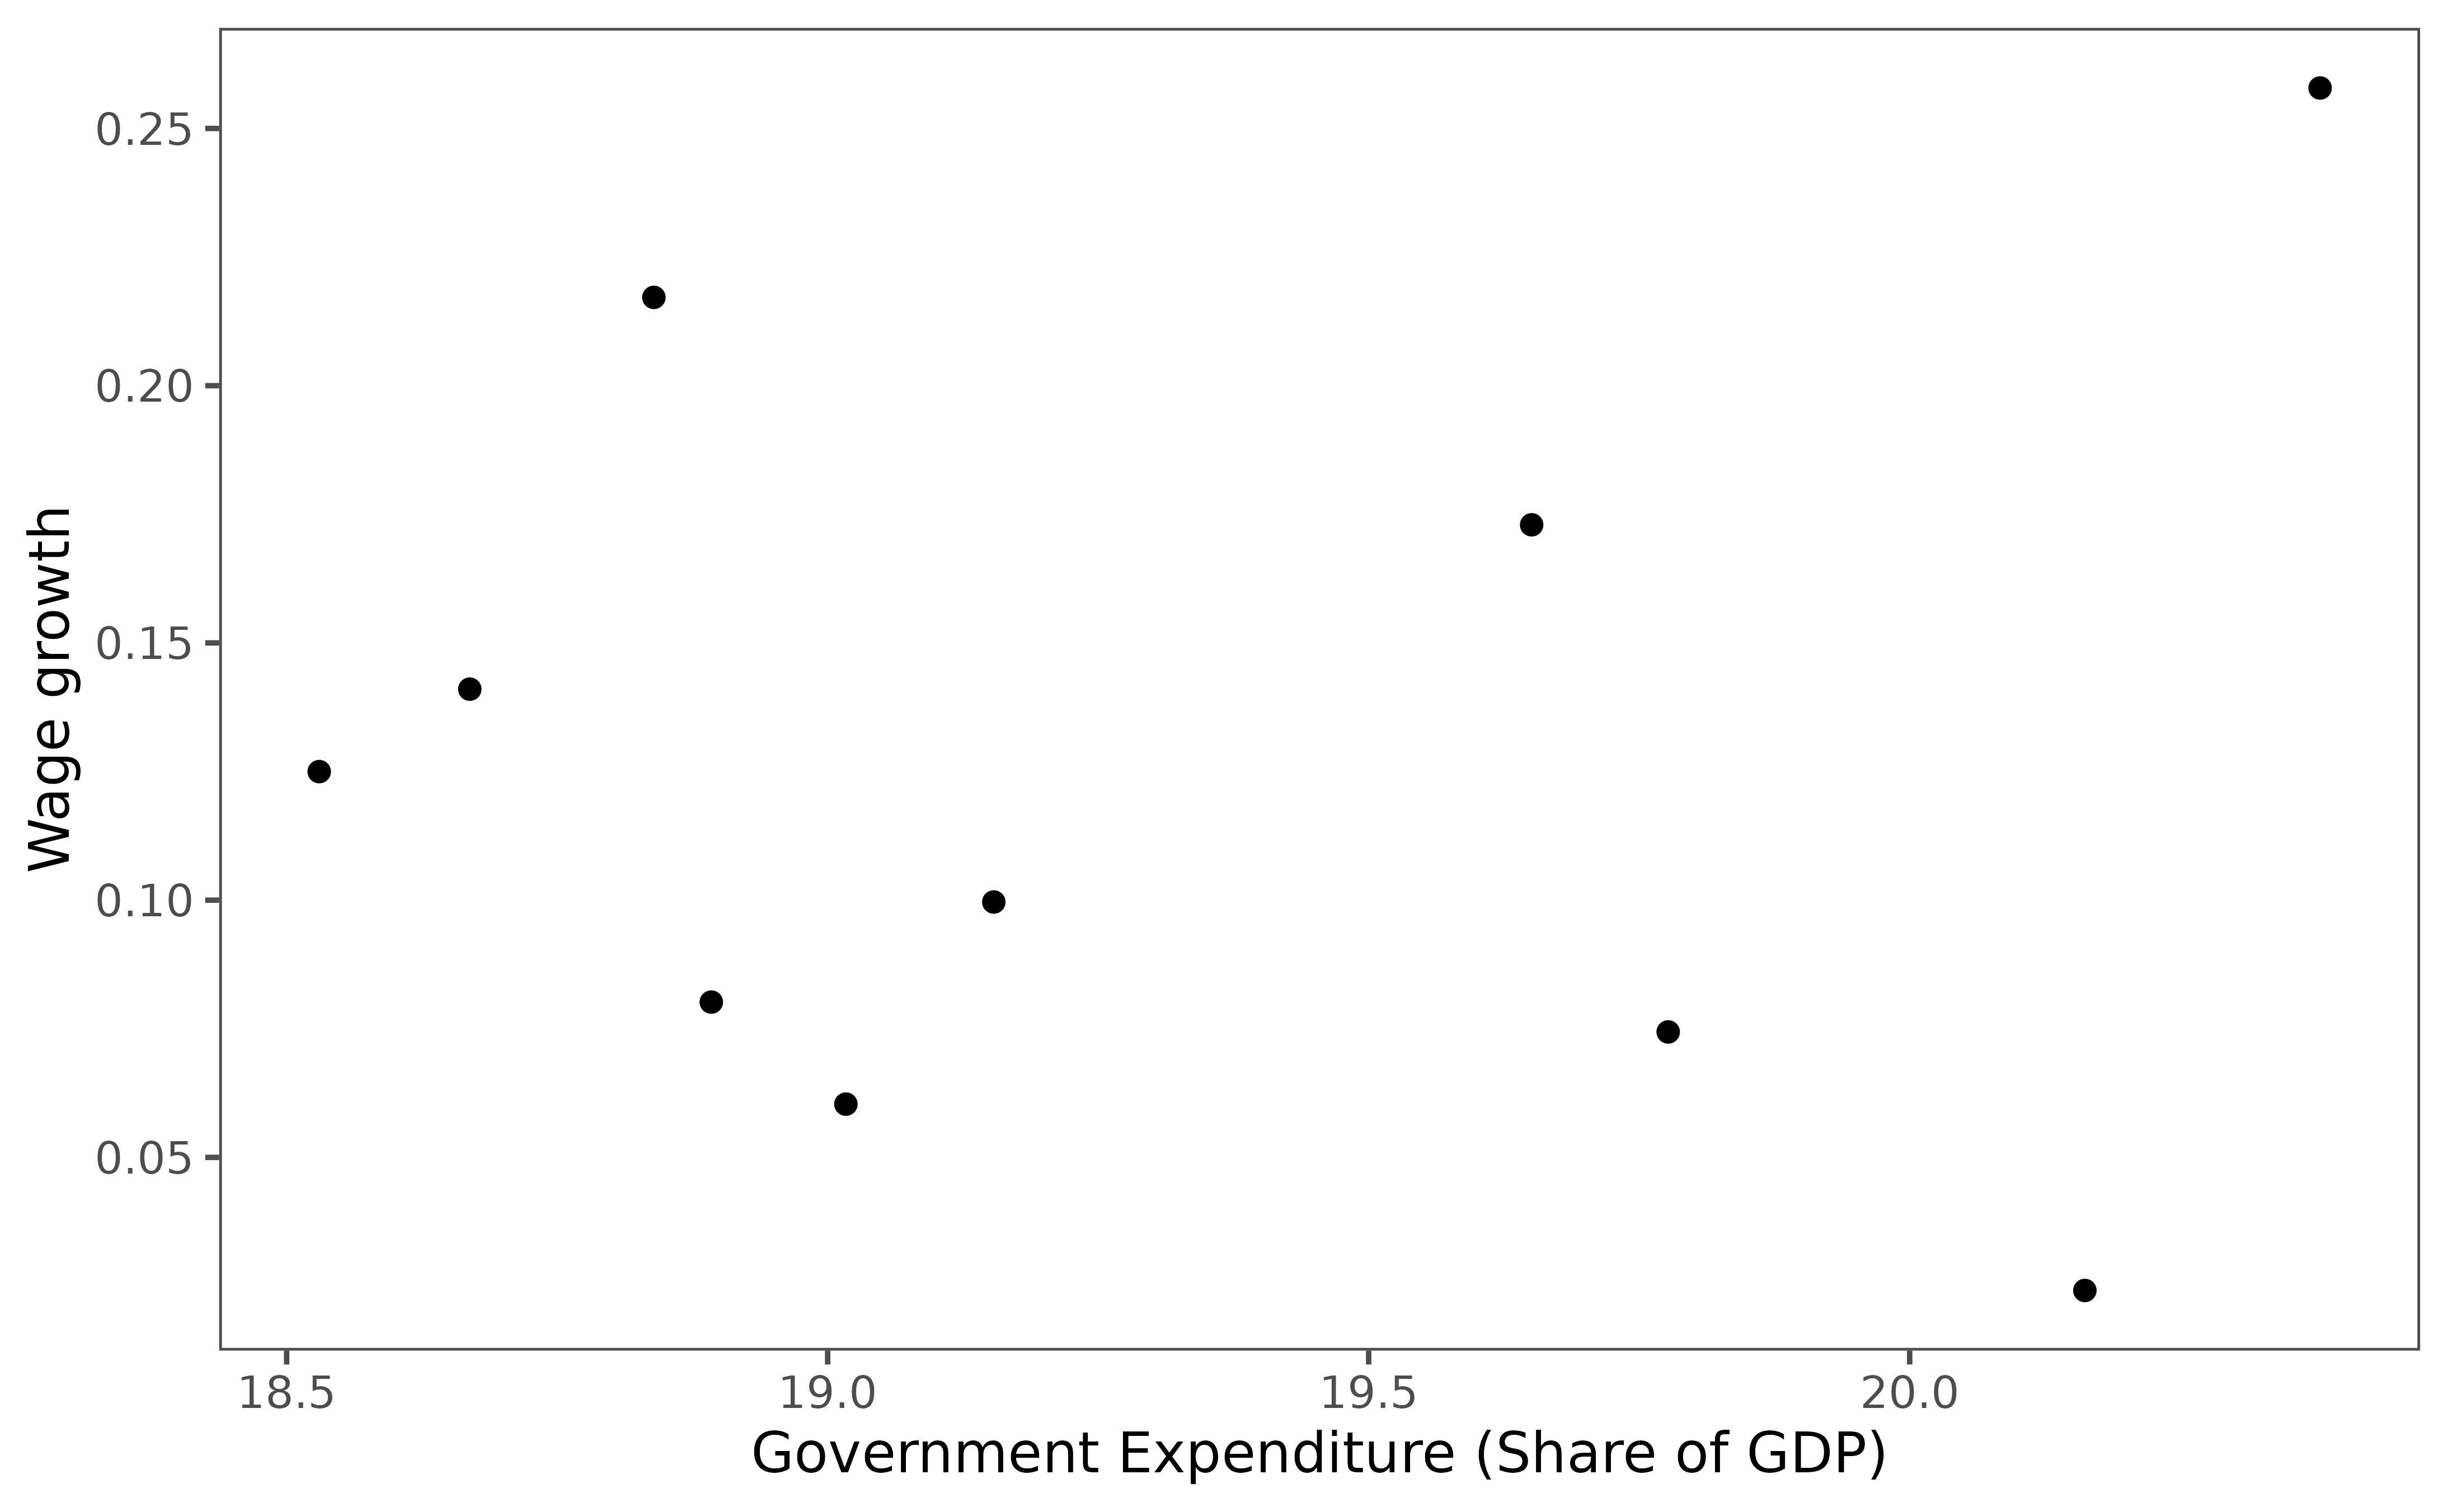
4.1.2.Correlation between wage bill growth and changes in capital and non-wage recurrent expenditures
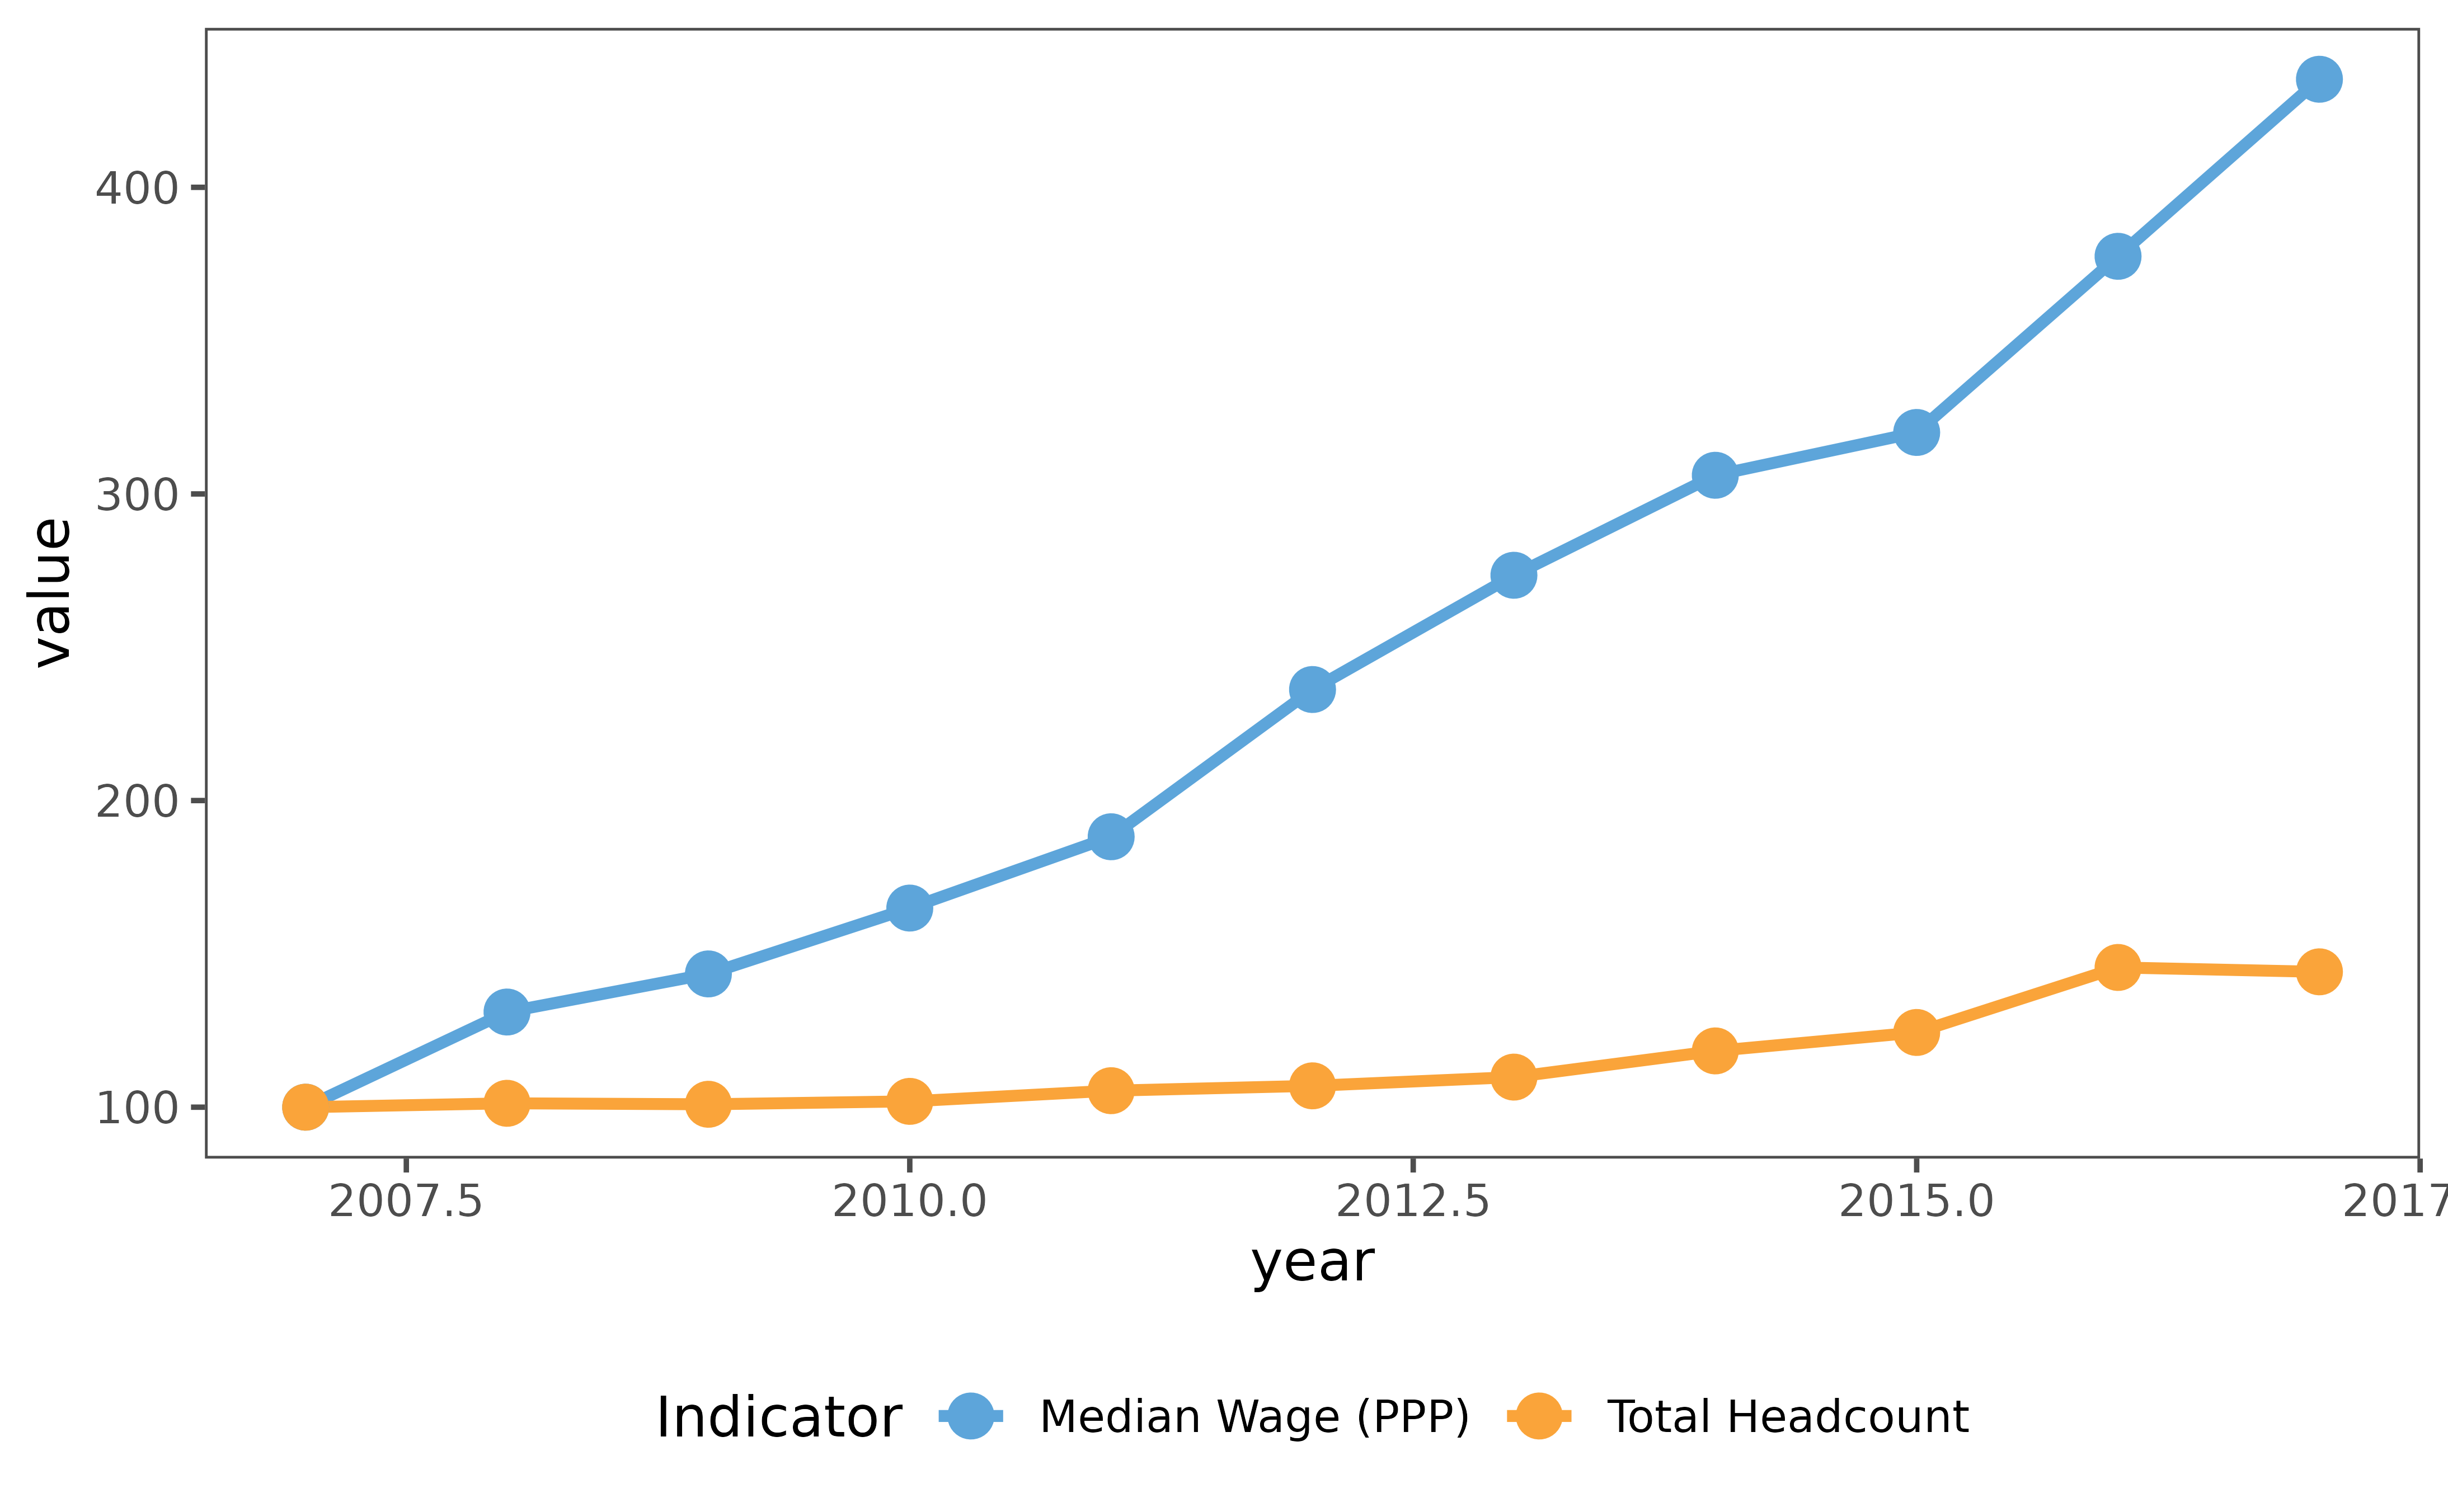
4.1.3. Decomposition of wage growth: employment and wages
A key question is whether the public sector workforce is performing well and delivering high quality infrastructure, services, and regulations, which is really a question of public sector labor productivity. Productivity measures the efficiency with which inputs, like labor, are converted into outputs, and is a more precise and economically meaningful concept than “performance,” since presumably performance can be improved by spending more while productivity measures whether more is produced and delivered for a given wage bill.
Measuring labor productivity in government is challenging, mainly because of the difficulty in defining and measuring government outputs. For example, functions such as defense, foreign relations, and environmental protection are difficult to quantify with respect to prices, as well as services for which there are no market transactions. Given these challenges, a diversified approach to measuring outputs must be used. These alternative measures can be distinguished into macro approaches, which provide information at the level of an establishment, sector, or service as a whole; and micro approaches, which be applied to the individual employee, task, project, and process.
Guidance questions for the assessment.
- Is total labor expenditure in the sector, including staff wages, outsourced labor costs, and external consultancy fees,correlated with sector-specific improvements in public-sector outputs and outcomes, so that productivity measures are stable or increasing within sector over time?
- Using subnational data, if available, are there any outliers in the current distribution of total labor expenditure, publicsector output measures, outcome measures, or measures of productivity? Are there any outliers in the trends of these subnational measures—for example, recent rapid growth or declines in a particular subnational entity)? What might be the underlying features explaining the existence of such outliers?
- Are total labor expenditures and public sector wages correlated with measures of institutional quality over time? Measures of institutional quality include the Worldwide Governance Indicators, perceptions of the quality of governance through household surveys – such as Eurobarometer, Afrobarometer, or World Values Surveys – the OECD’s Government at a Glance Indicators, the Quality of Government Index, and the World Bank’s Doing Business Indicators. With household level data and any other subnational data on measures of institutional quality, are there any outliers across subnational entities in the current distribution of institutional quality or outliers in the trends of measures of institutional quality?
4.2.1. Correlation between wage bill growth and public-sector outputs and outcomes.
Public sector employment and compensation policies can have major impacts on the entire labor market, particularly in low- and middle-income countries where the public sector is the dominant formal sector employer. Globally, the public sector accounts for 38 percent of formal employment, reaching almost 50 percent for low-income and lower-middle and countries. This large labor market presence, combined with public sector wage premia and job security, can lead to unemployment, particularly for fresh university graduates who queue for public sector entry level job openings and reject private sector job offers.
Guidance questions:
- Is the public sector crowding out the labor market, impeding private-sector job growth for specific skills, occupation, demographic, and geographical groups?
- Is the public sector having a distortionary impact on younger cohorts, particularly fresh university graduates, causing them to queue for public sector jobs and reject private sector jobs?
4.3.1. Public sector wage premium
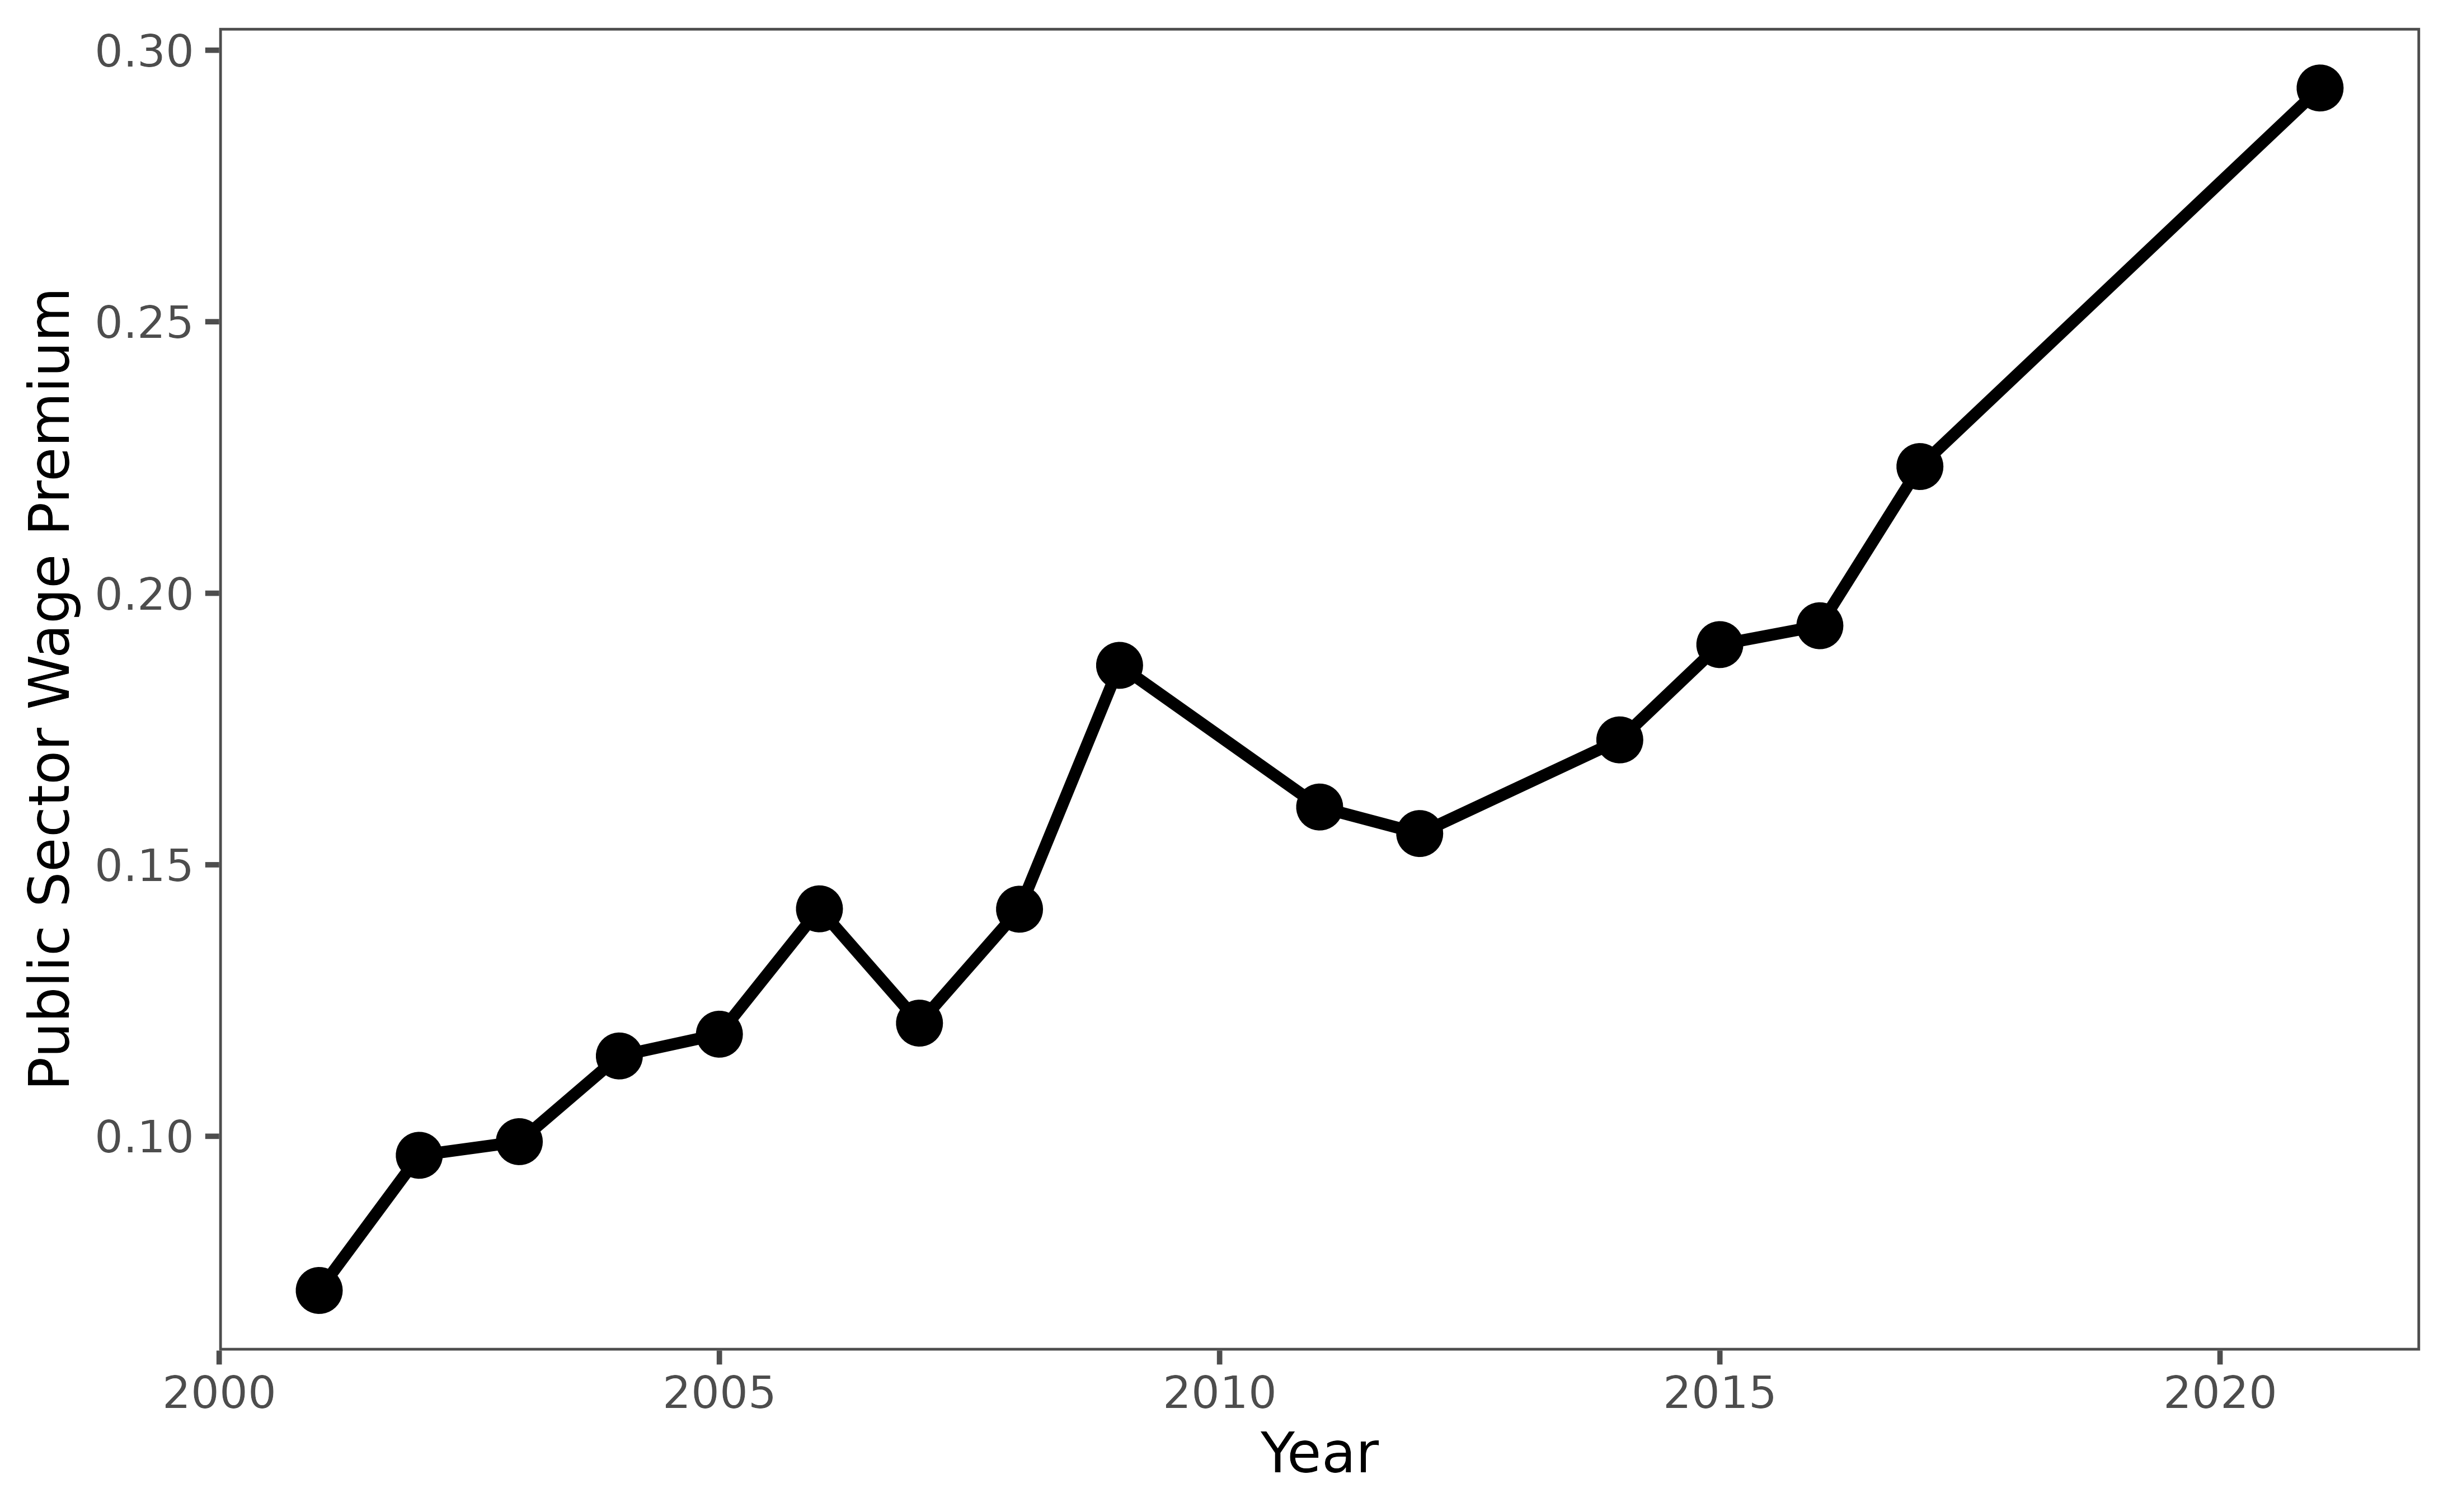
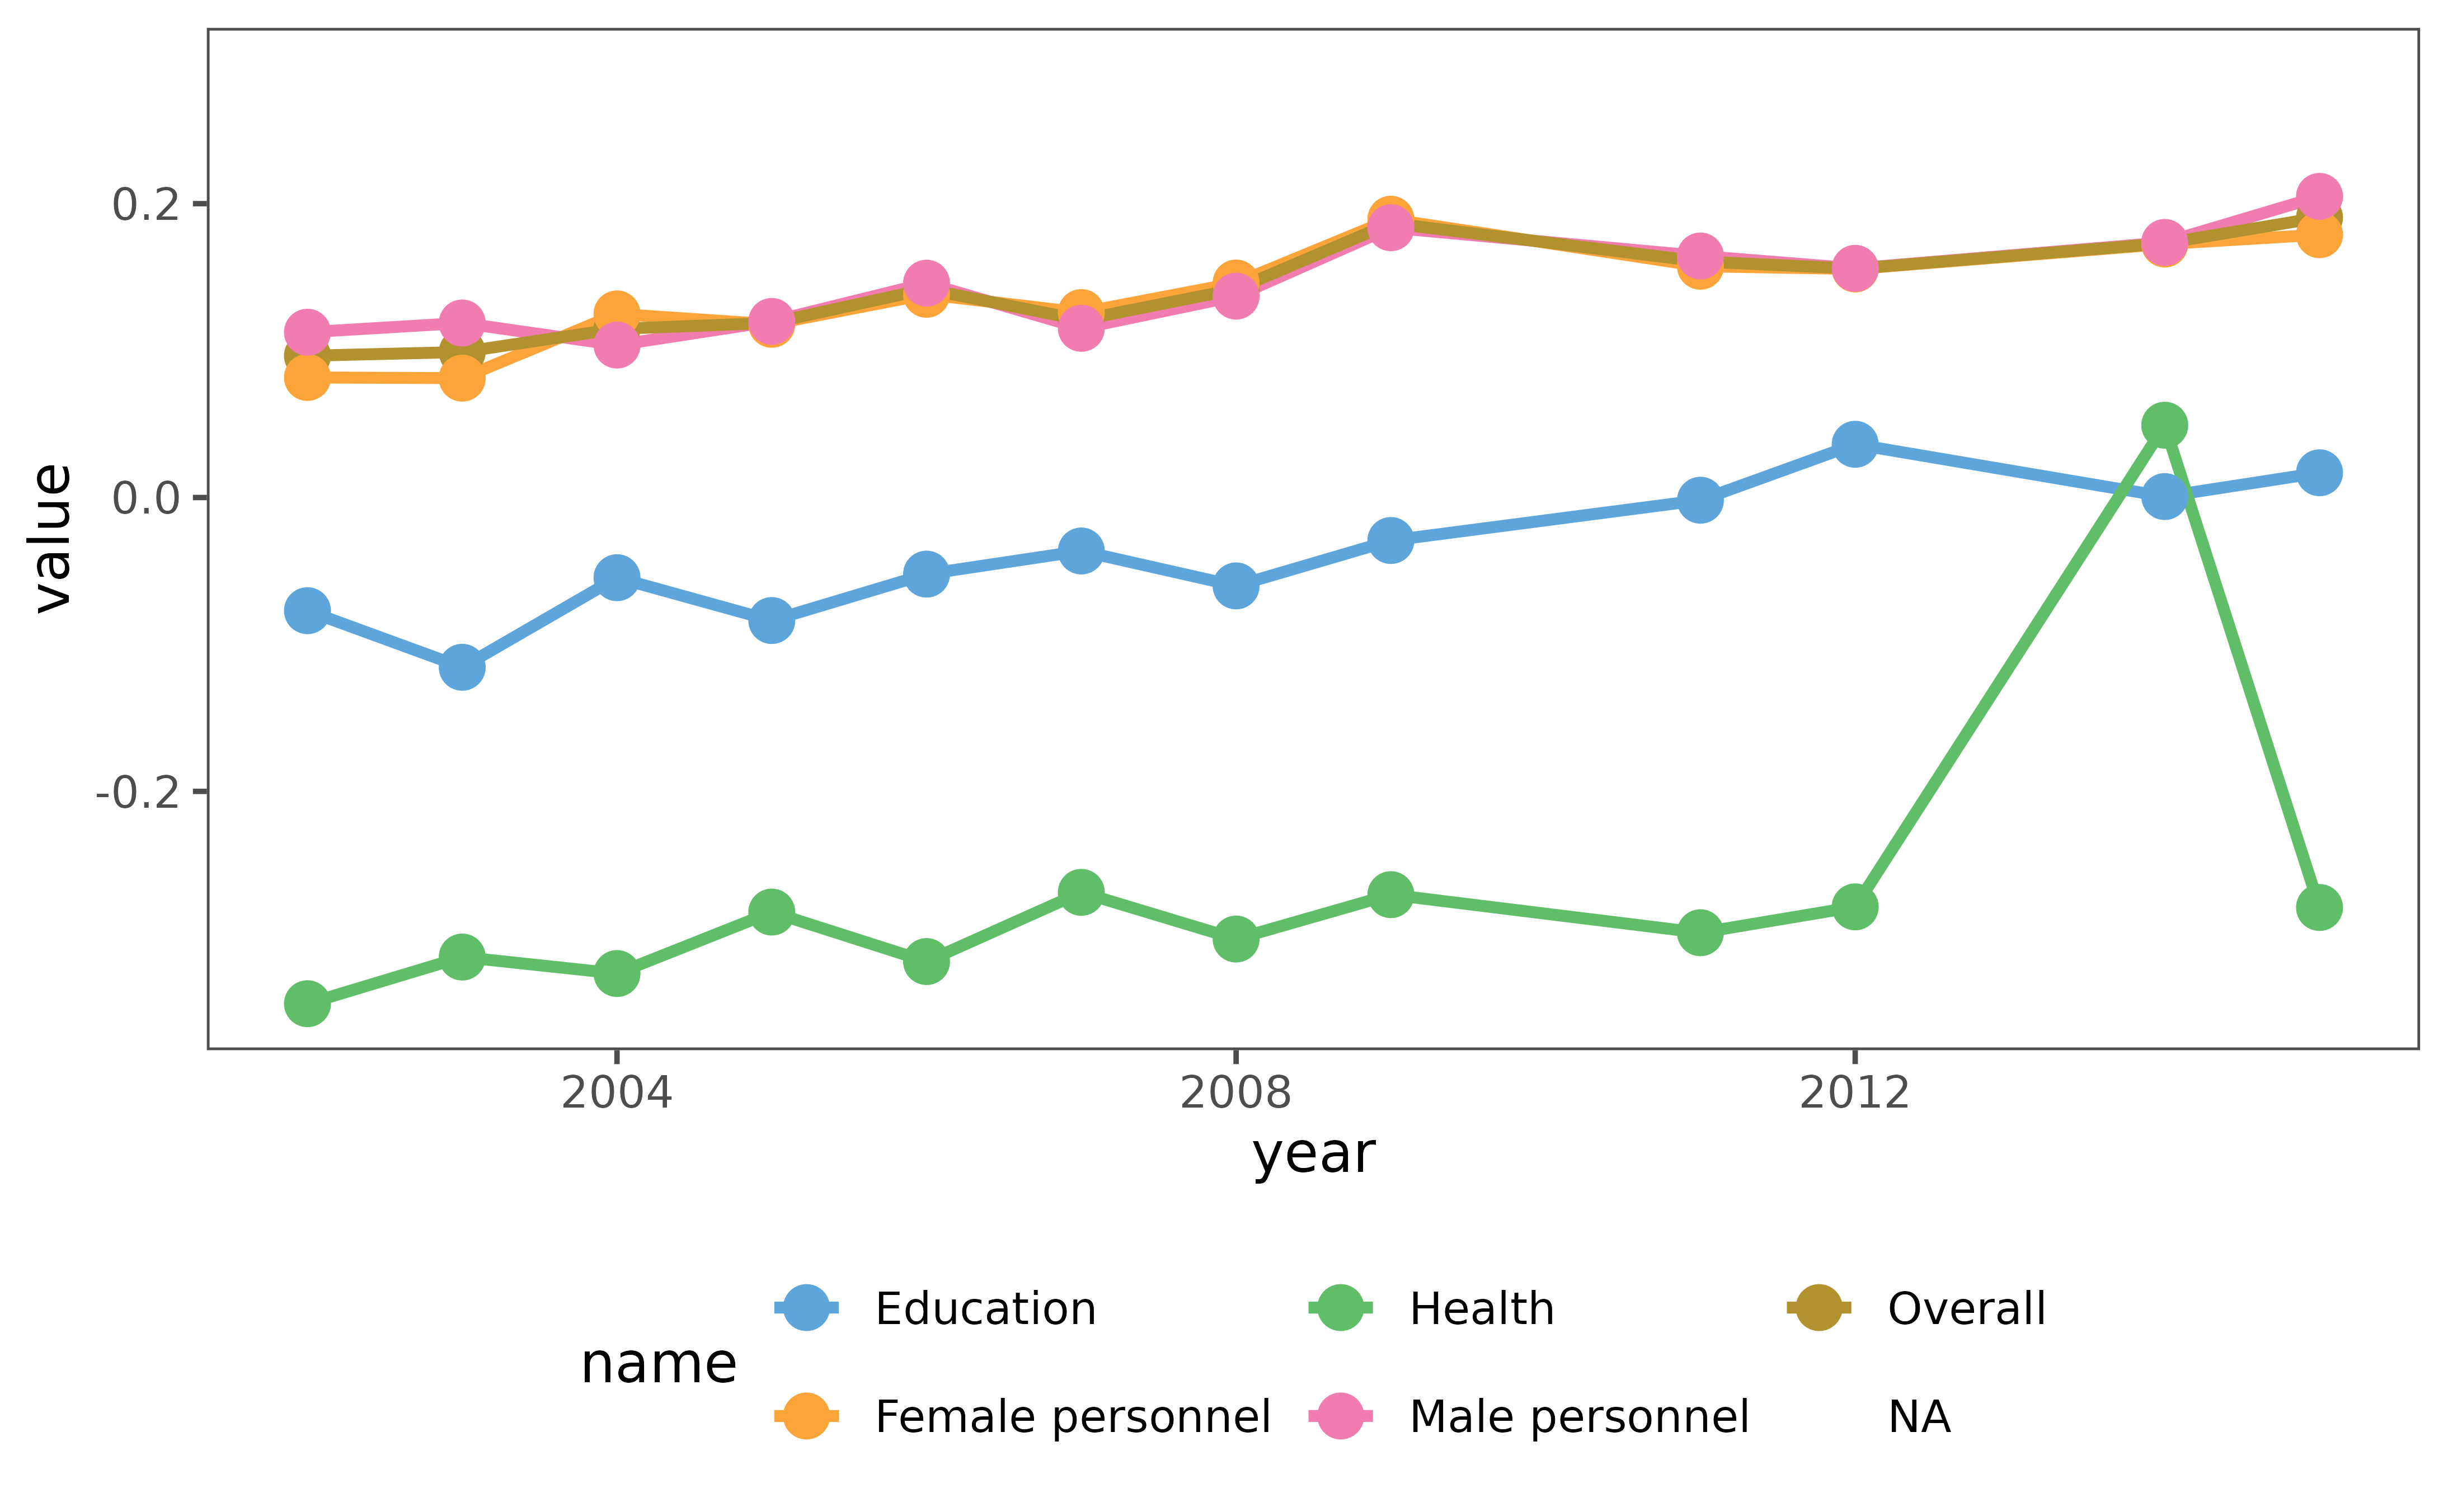
Multi-line plot showing public sector wage premiums by sector (education, health) and gender from 2002-2015. Different colored lines show how wage premiums vary across demographic groups and sectors over time.
4.3.2. Number of applications per position N/A
4.3.3. Correlation between public sector employment growth or recruitment patterns and private-sector employment growth or recruitment patterns (by skill, demographic, occupation, and geographical groups)
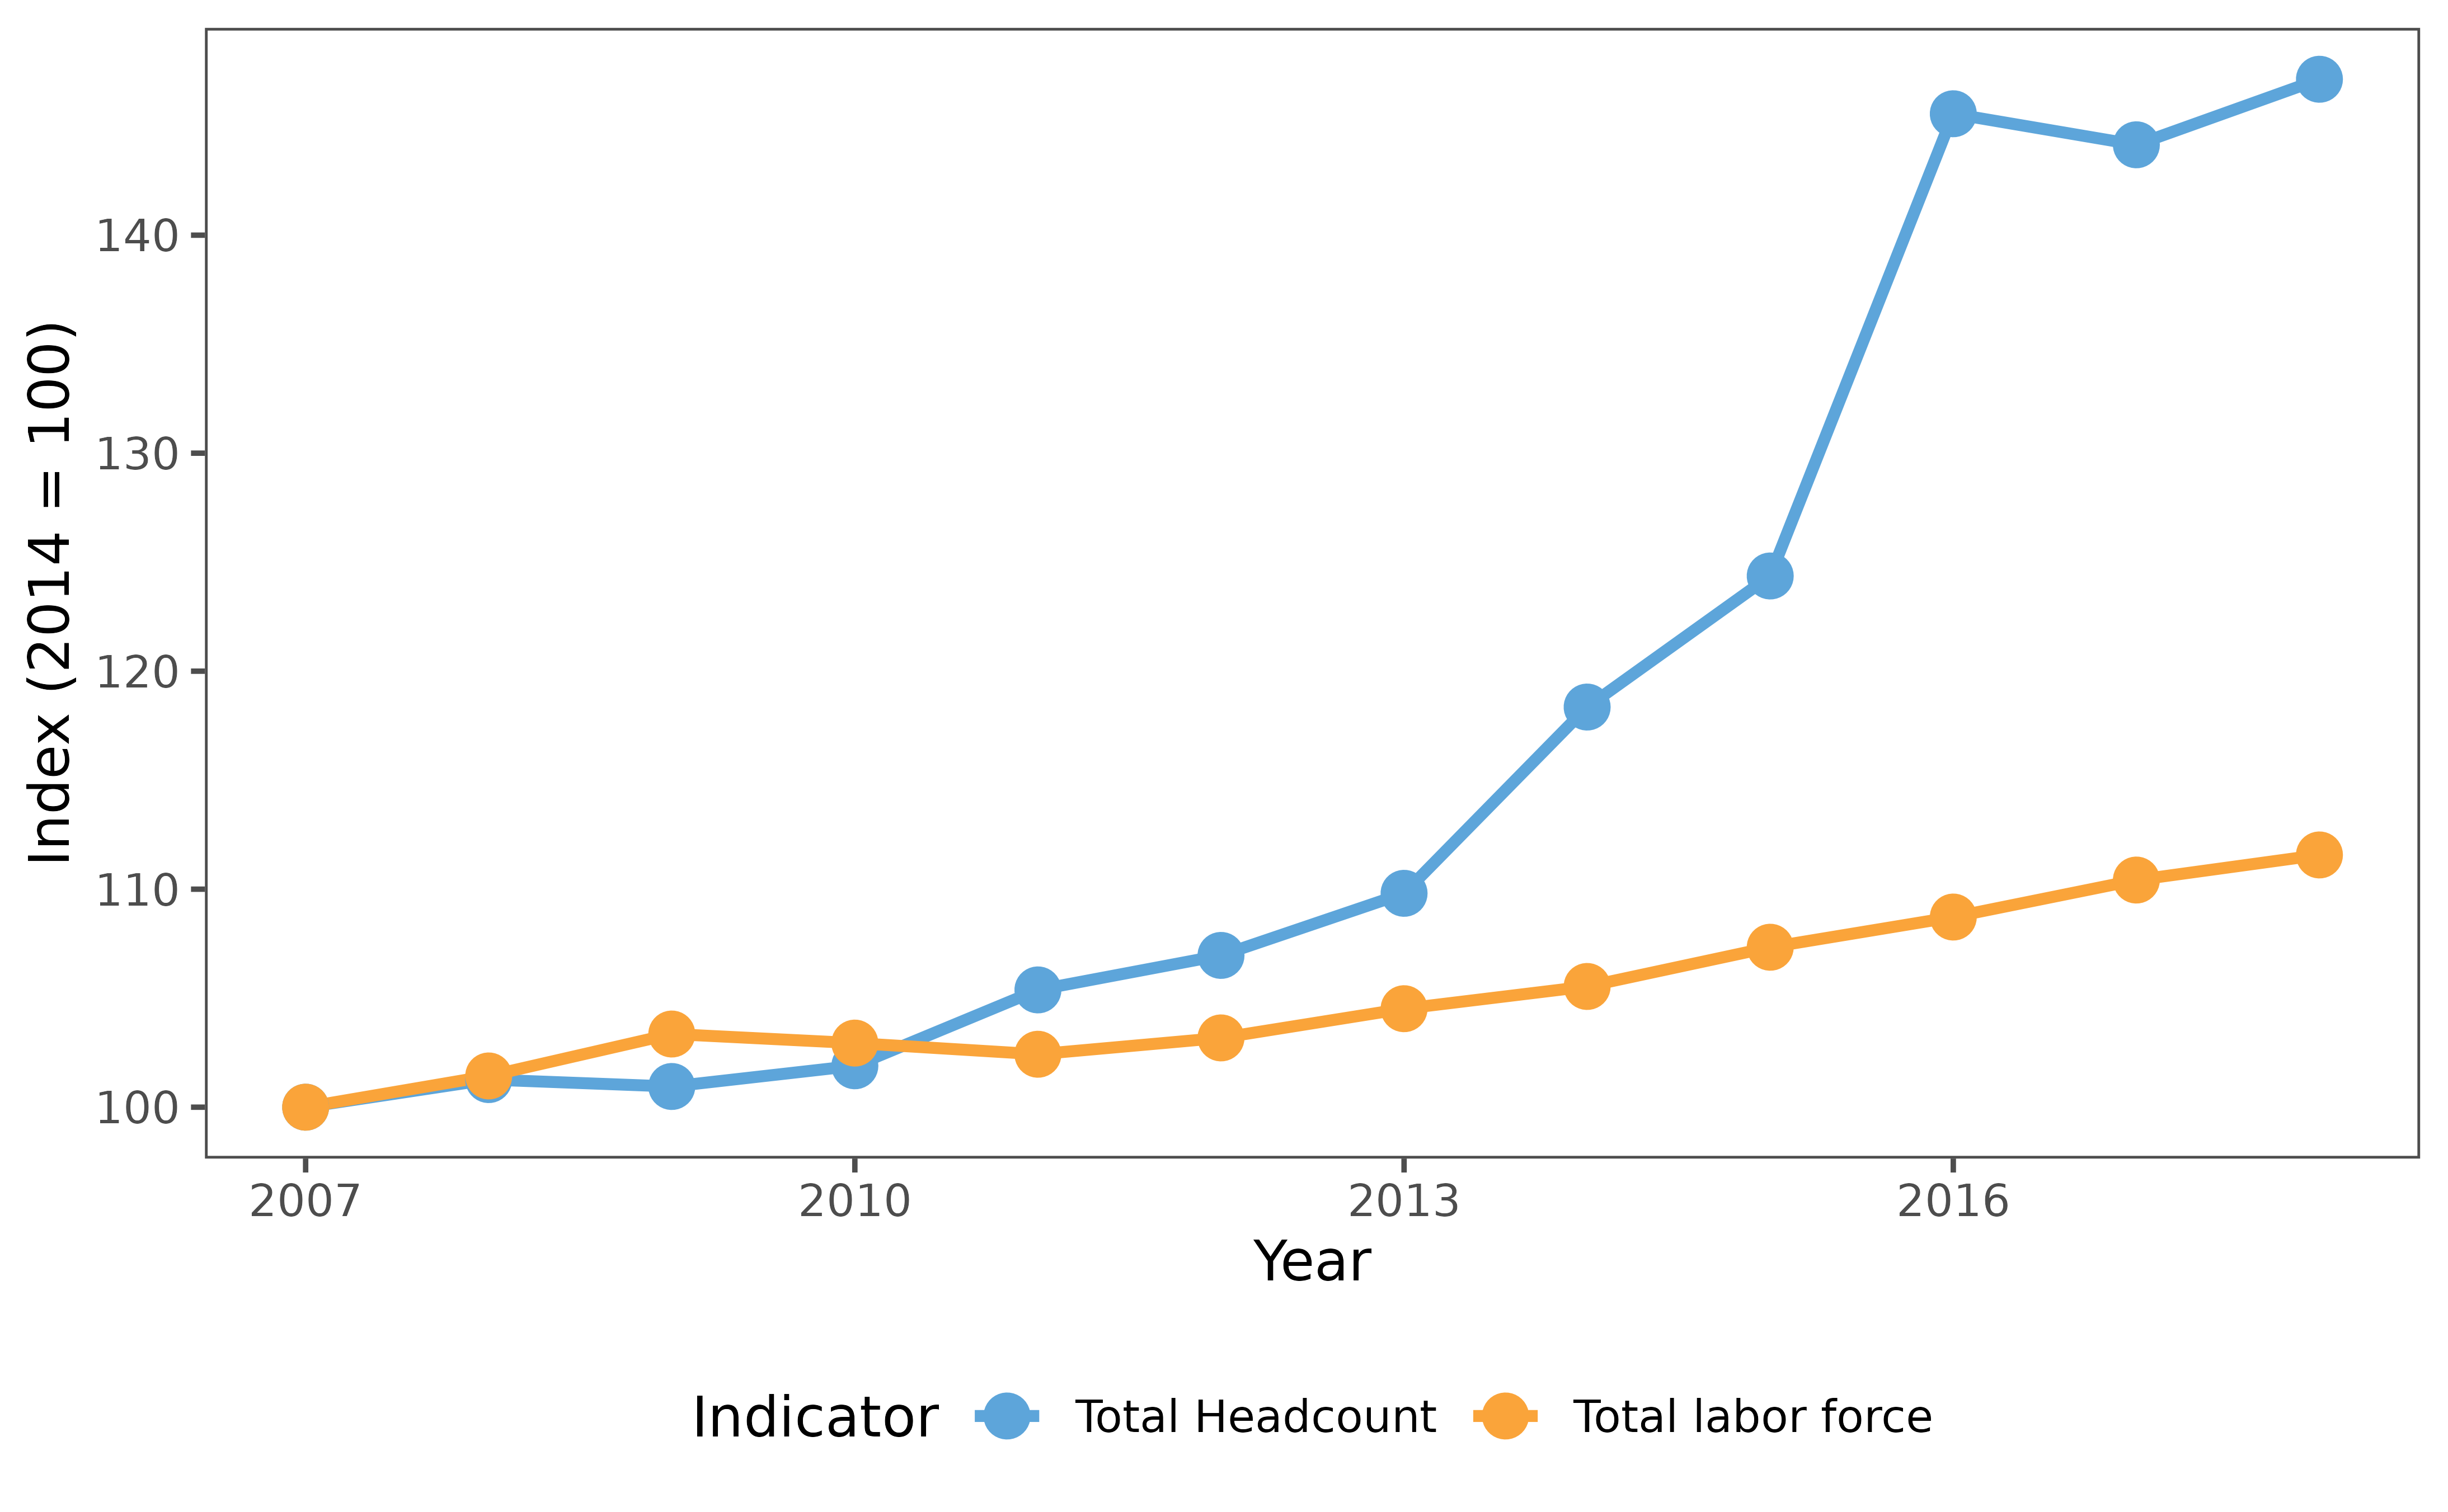
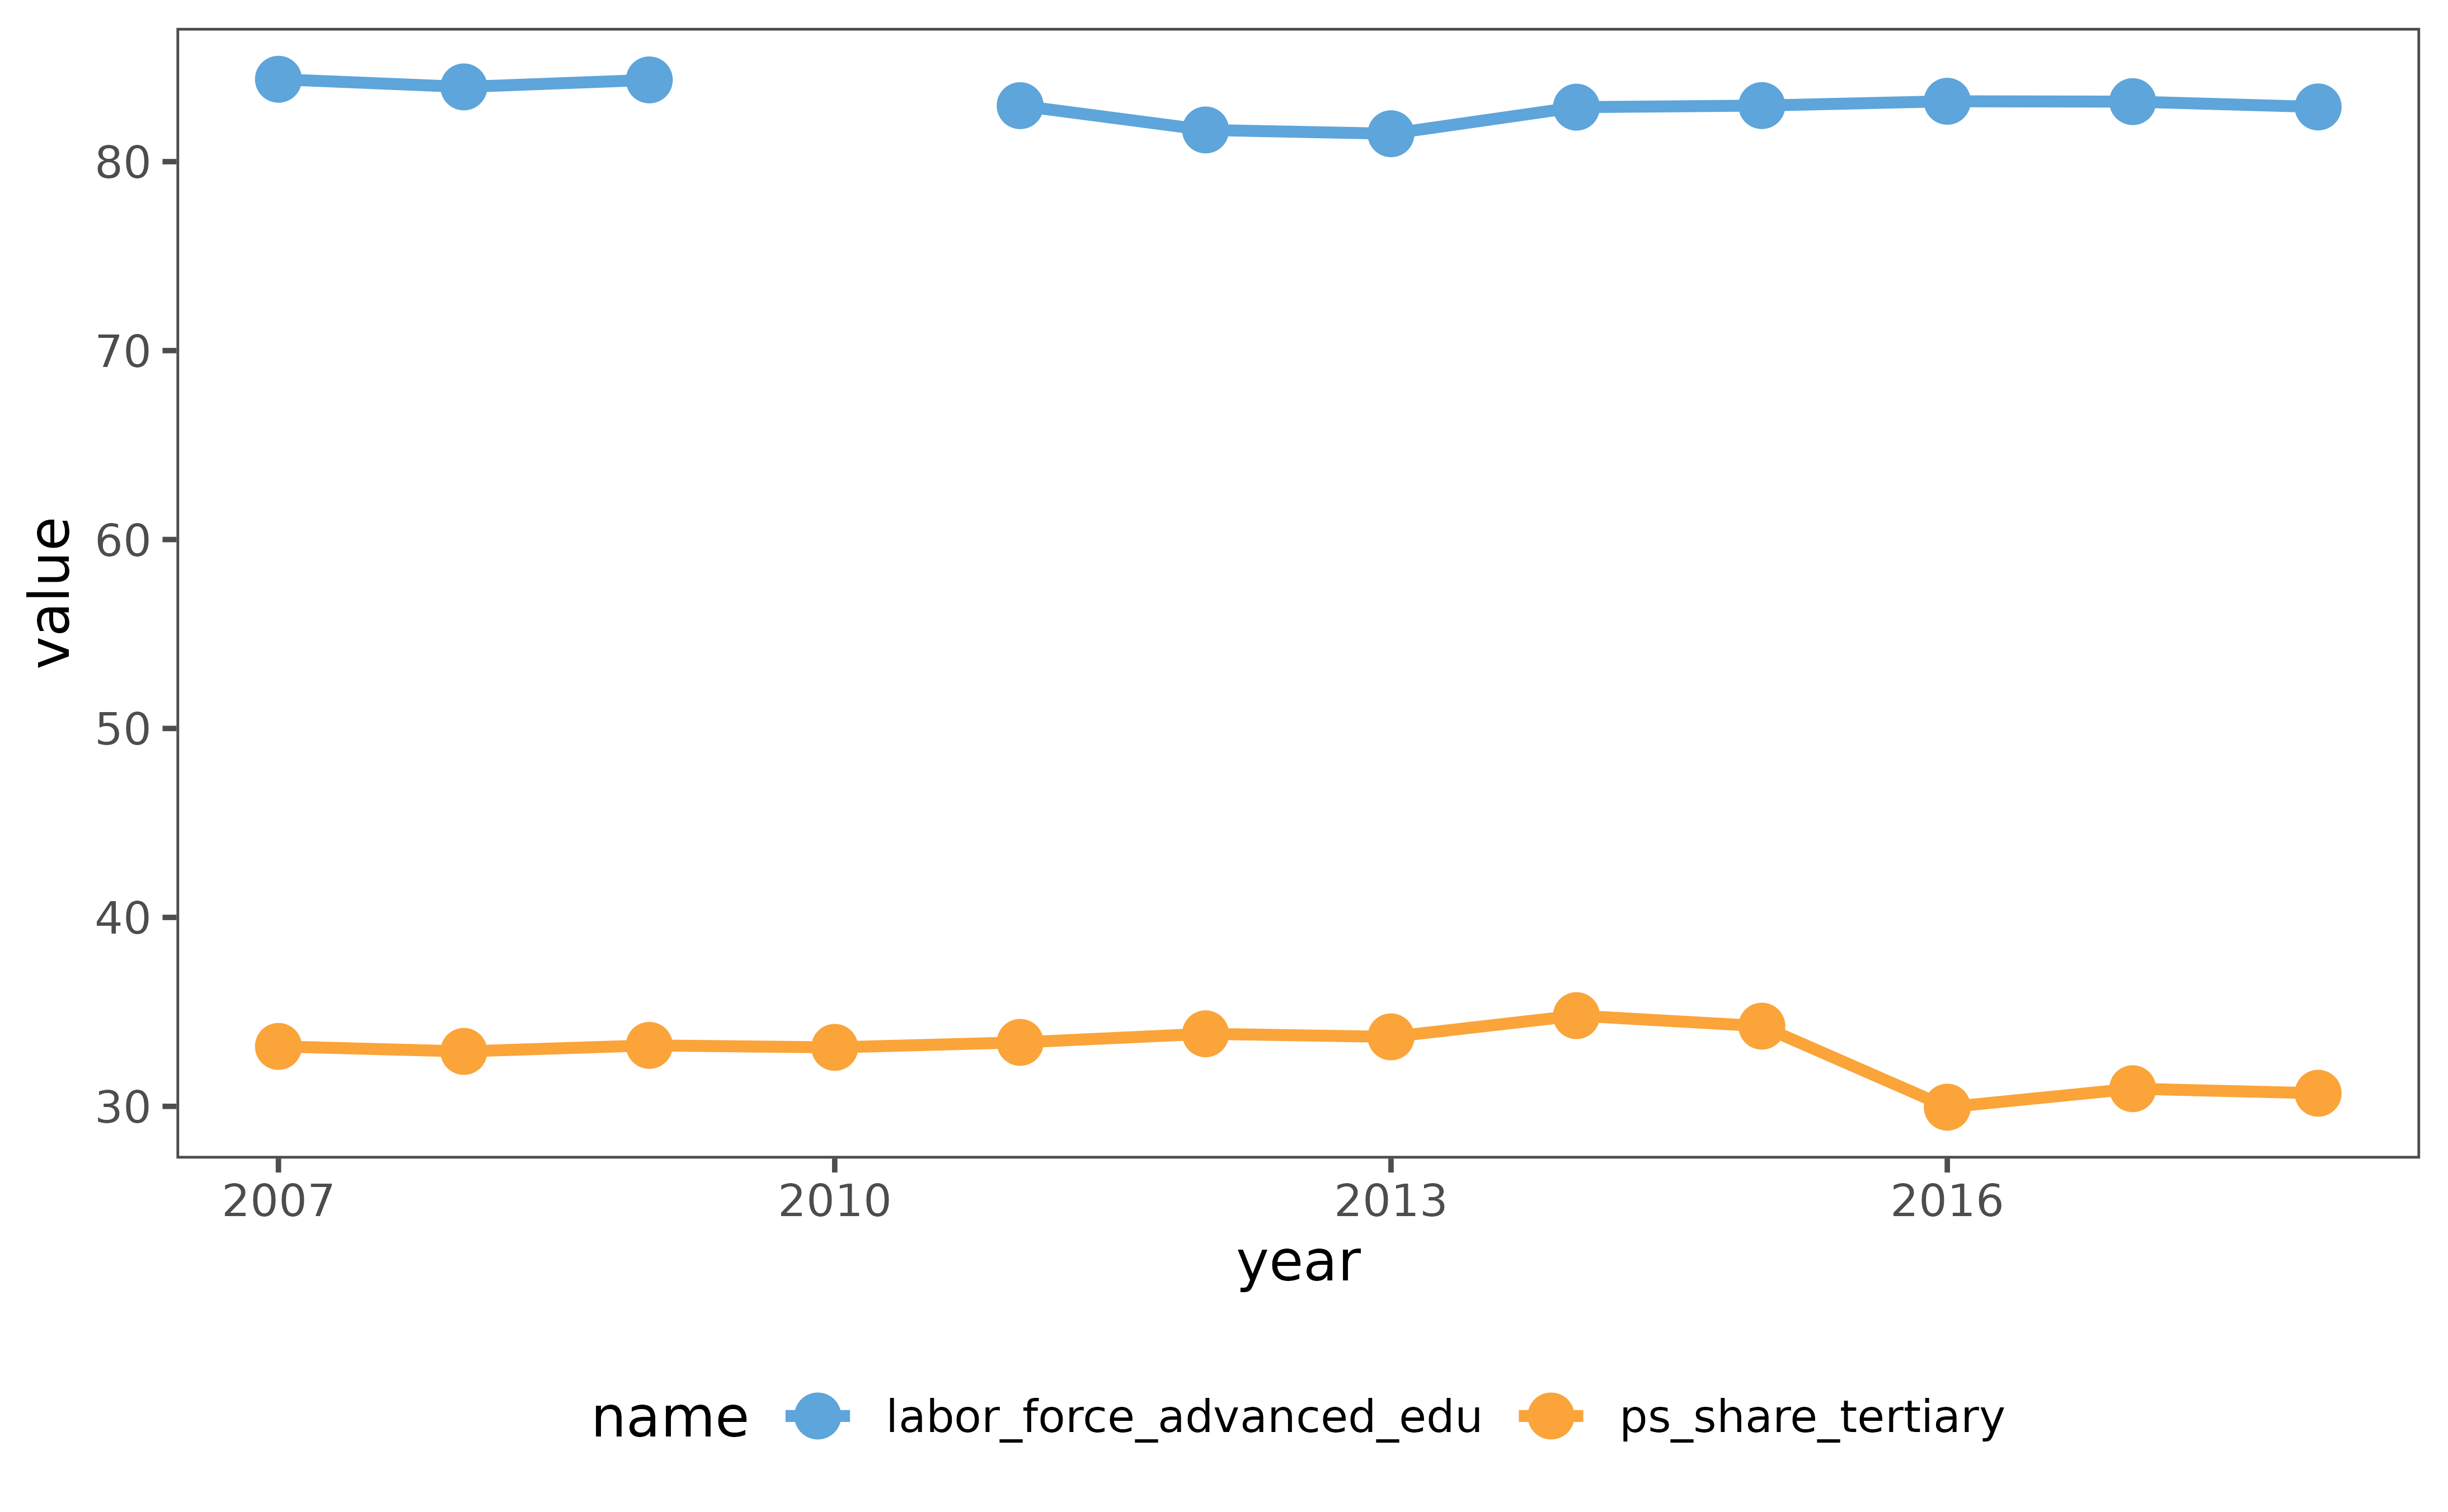
4.3.4. Trends in educational profiles of public-sector personnels
relative to private-sector personnels (by demographic, occupation, and
geographical groups)
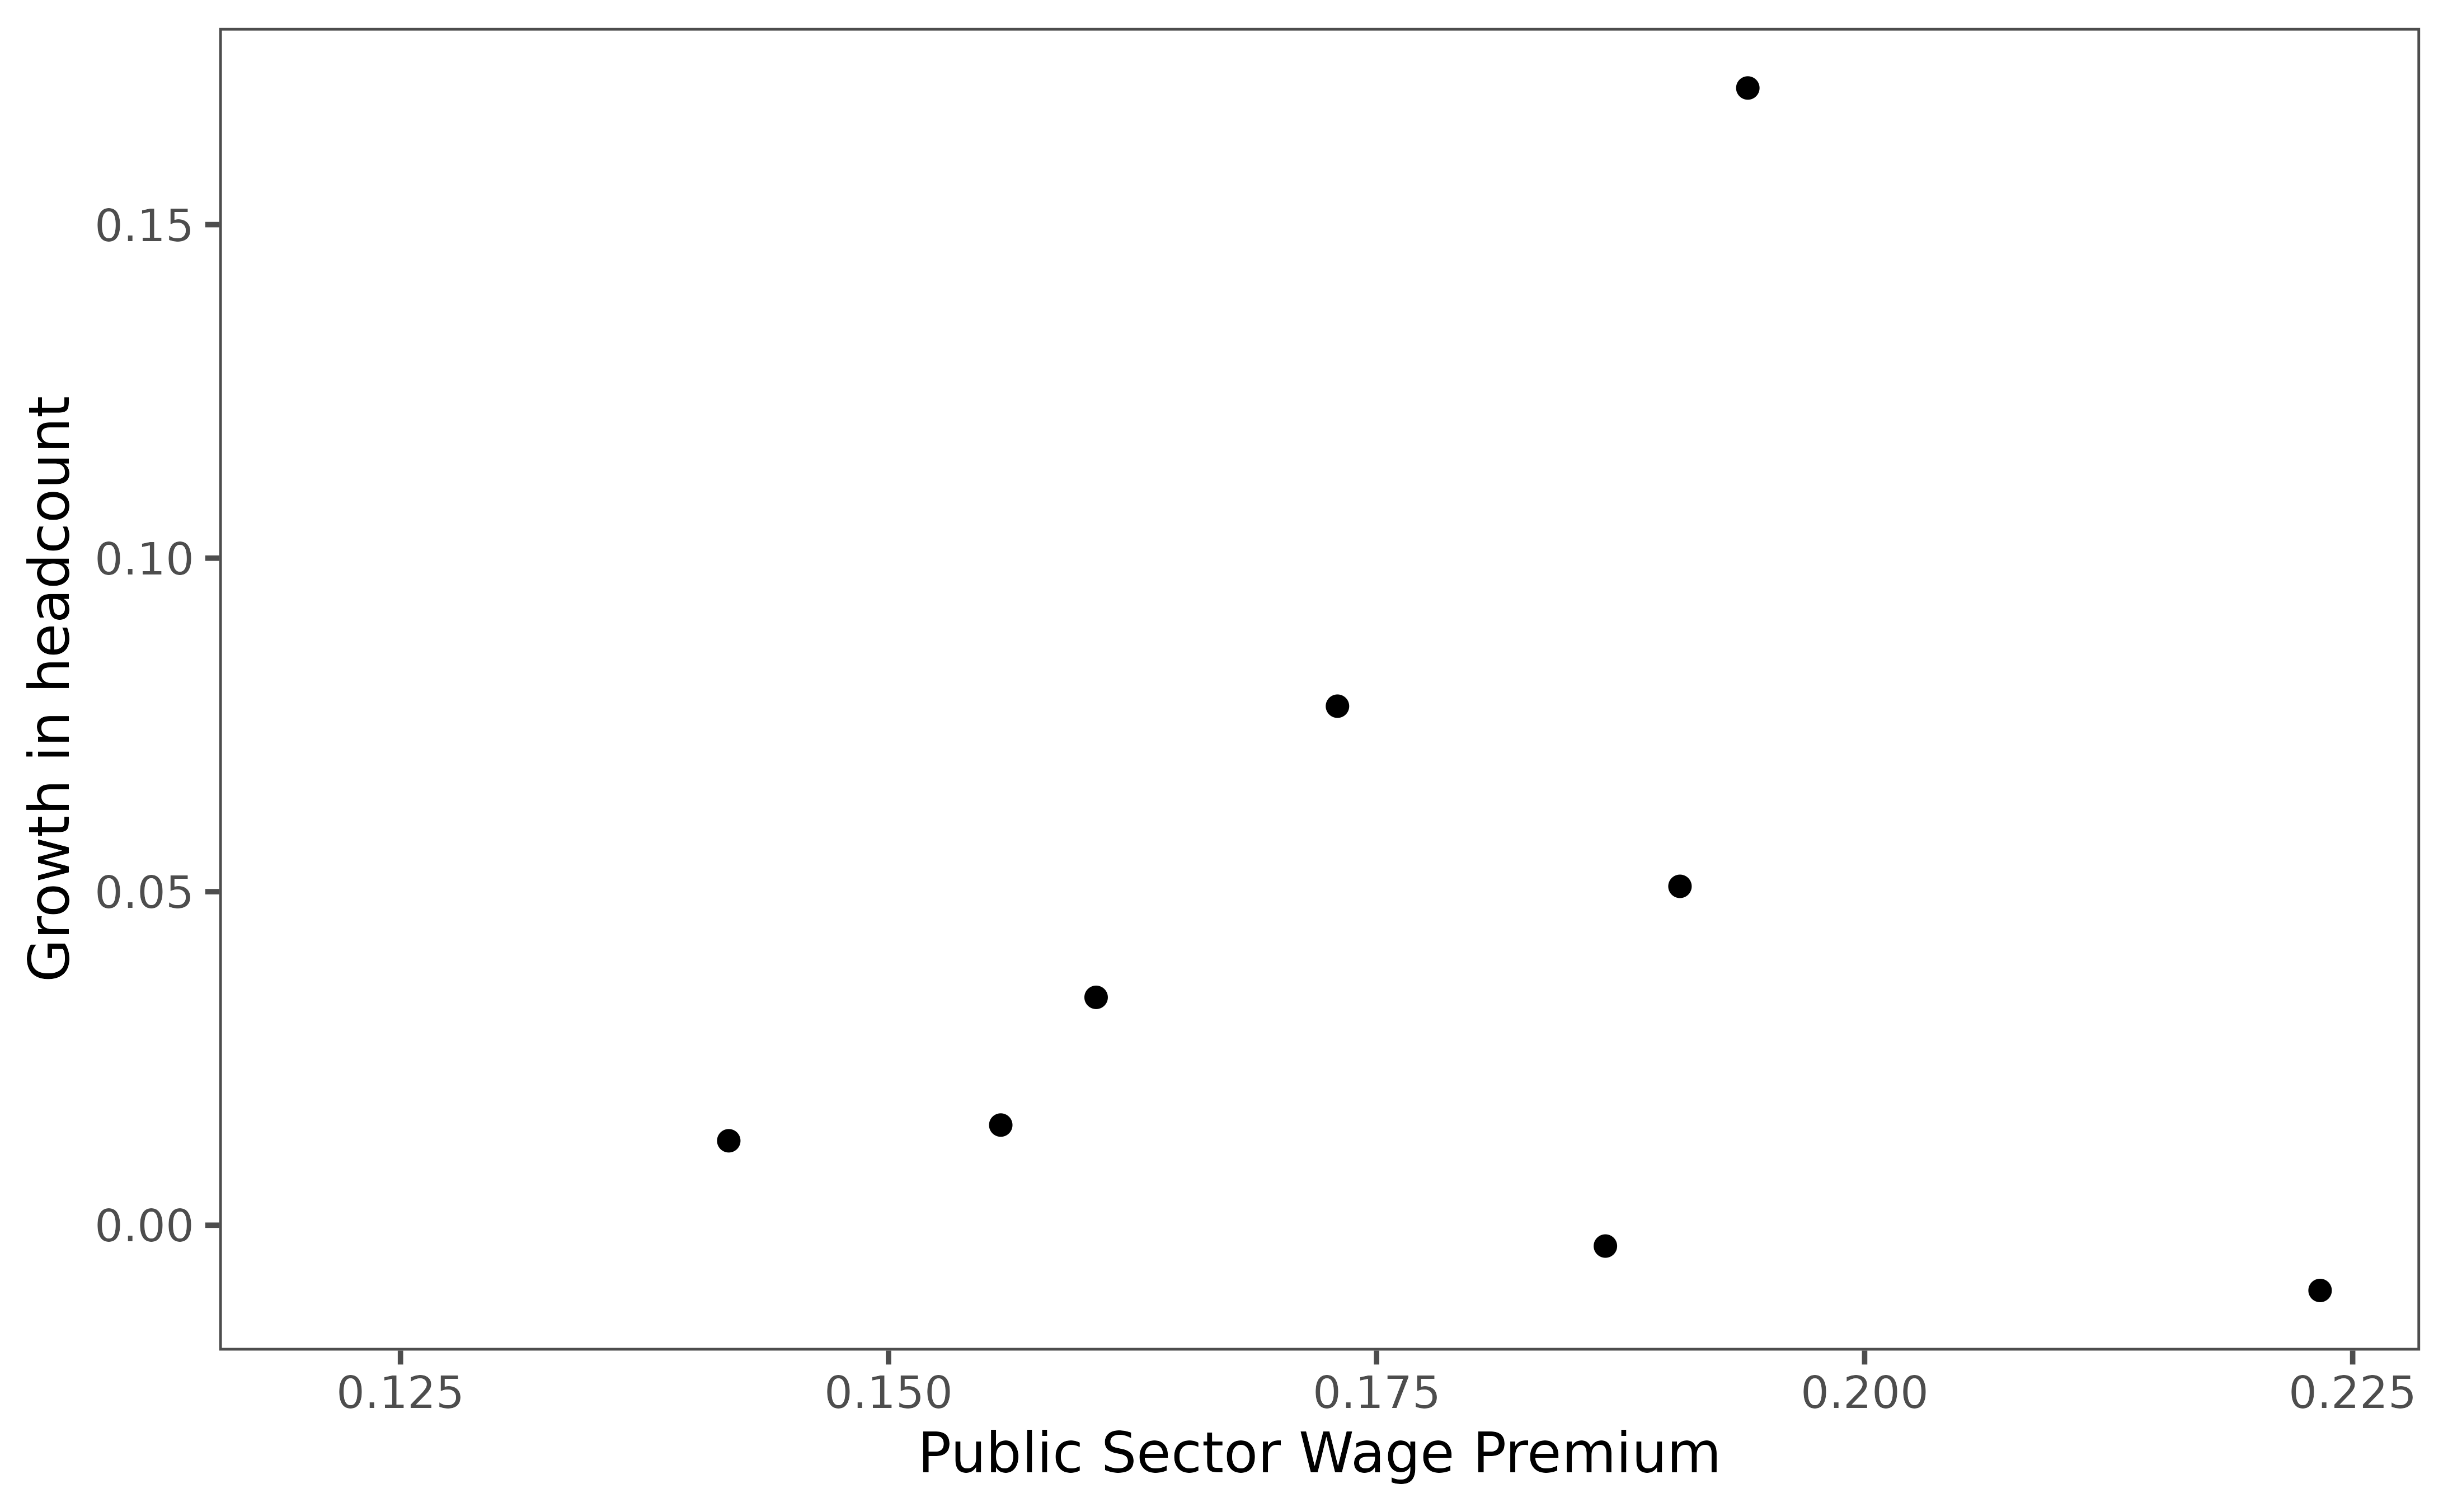
4.3.5. Correlation between public-sector wage premium and relative employment growth in the public sector (by skill, demographic, occupation, and geographical groups)
4.3.6. Skills shortages in the private sector (from firm surveys)
## [1] "Enterprise surveys coverage is limited."